#449 | A DIR Proof Point

AI was used to proof-read and cross-reference existing articles. No part of this article was written with the assistance of AI.
There is probably no single metric as broadly misunderstood within the industry – and maligned outside of the industry – than the Dividend Interest Rate (DIR). I’ve heard agents incorrectly explain the DIR as the pure “yield” on a Whole Life policy. I’ve heard laypeople describe the DIR as “meaningless.” Life insurers are quick to publish their overall dividend payout but generally shy away from marketing their DIR because they’re concerned about it being mischaracterized by agents and misunderstood by consumers. They point out, correctly, that what matters is the overall dividend payout and continued competitiveness of their products. The DIR is simply an input into the formula.
It also happens to be an input that is calibrated in a unique way to each life insurer. An apt analogy for the DIR is the famous scene in This is Spinal Tap where lead guitarist Nigel Tufnel explains that one very special Marshall amplifier “goes to 11” when they need an “extra push.” It’s such a brilliant scene and perfectly encapsulates the dynamics of the DIR. It’s true that going to 11 on that particular Marshall amplifier creates an extra push. Comparing the change in the DIR over time for a particular carrier is a true indicator of the relative performance of the carrier’s products over time. It’s internally consistent.
Problems arise in the comparison of DIRs. Consider the fact that when MetLife was selling retail Whole Life a decade ago, its DIR of 5.1% produced similar illustrated performance to MassMutual’s 7.1% DIR. Or, to put it in Nigel Tufnel’s terms, MassMutual went to 11 and MetLife only went to 7 – never mind that the actual decibels were nearly the same. We see the same dynamic playing out in today’s market, where Penn Mutual regularly produces better illustrated performance with a lower DIR. As discussed in #415 | Penn Mutual Plays for Keeps, that’s because Penn Mutual calculates their DIR differently than everyone else. DIR is an effective tool for comparing performance over time at a particular carrier, but not for comparing performance at a particular point in time across carriers.
In other words, DIR is not a standardized measure across the industry that is helpful for comparison. Comparing DIRs would be like comparing top-line revenue across companies in a particular industry. Holding all else constant, top-line revenue would be directly correlated to bottom-line profits – but that’s not how it works in reality. Consider that Apple regularly accounts for less than 50% of global smartphone revenue but more than 80% of operating profits.
A similar dynamic plays out for DIRs. We can calculate the net crediting rate (NCR) that percolates through to the actual cash values by looking at the performance of a policy after endowment, which tells us if the carrier is applying an investment spread before crediting policy performance. The other expenses – mortality, overhead and commissions – are applied in the policy load structure, which shows up in the long-term IRR. Take a look at how these values break down for the Big 4. I’ve also added Penn Mutual but their policy endows at 121, which deprives us of an easy way to calculate the NCR. I used the 10 Pay for this example because it mutes the effect of policy expenses and focuses instead on NCR and mortality costs.
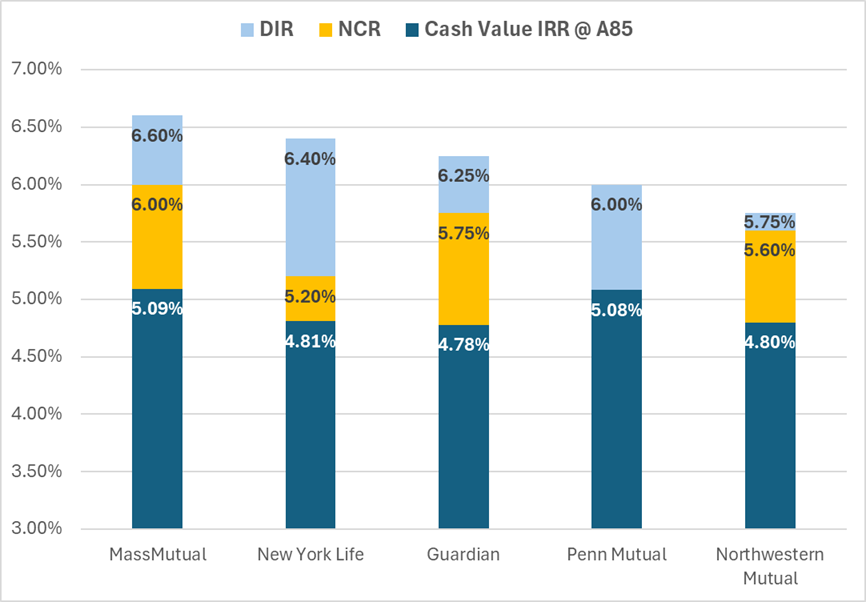
There are a couple of caveats. New York Life’s product uses a 3% guaranteed interest rate whereas the others use 2%, which means the death benefit corridor is wider and, therefore, mortality charges are more of a drag on performance. Secure Wealth Plus, New York Life’s 2% guaranteed rate 10 Pay product, actually out-illustrates MassMutual’s 10 Pay product, but it also pays less compensation. But even these caveats support the broader point – top-line DIR is not directly correlated to bottom-line performance across products. Just because a company offers a higher top-line DIR doesn’t mean the policy actually delivers better performance than its competitors. The actuary at MetLife used to joke that he would just add a 2% expense load to the MetLife Whole Life products in order to get the DIR to 7.1% to match MassMutual’s headline rate without changing the actual performance of the policies. He was only partially kidding.
The closest comparison in the set is Northwestern Mutual and Guardian. The products are priced nearly identically in terms of premium, with just a 3.5% gap between the two in this cell. Guardian has the higher DIR, but Northwestern actually wins on IRR despite having a 50bp disadvantage on top-line DIR. The reasons aren’t hard to see. Guardian takes 50bps right off the top of the DIR for expenses and Northwestern only takes 15bps, which means the NCRs are close – 5.75% for Guardian, 5.60% for Northwestern Mutual. Expenses in Whole Life are deducted as premium loads. On a 10 Pay product, that means expense loading is obvious to see in the IRR over 10 years. On that metric, Northwestern Mutual beats Guardian by 30bps. Over time, the 15bp advantage in NCR allows Guardian to catch up to Northwestern. But the fact that these two products are so close is a near-perfect case study in why looking to DIR alone for comparison across companies is almost useless.
What DIR may lack in usefulness as a tool for comparison across products, it more than makes up for as a way to understand the performance history of a particular company’s products over time. Whole Life is a fixed premium product with a contractual relationship between guaranteed cash values and the guaranteed death benefit. All future dividends, if taken in Paid-Up Additions, will follow along a prescribed path of cash values as well. This stands in stark contrast to Universal Life which, as I’ve written in previous articles, is a highly complex financial instrument chock full of non-linear math that is the necessary result of moving from tabular values to declared policy charges and credits. I’ve joked many times that Whole Life is life insurance for dummies – and it’s true. It is.
But the beauty in the rigidity of the chassis itself is that it is very predictable. You don’t need to account for the complex relationship between Net Amount at Risk and Cost of Insurance charges that has to be carefully managed in a Universal Life product because the relationship is already built into the tabular values of a Whole Life policy. There are no explicit mortality costs that can balloon over time in Whole Life. The structure of an all-base Whole Life policy can’t change over time. It’s a done deal.
That little insight has profound implications for how we understand Whole Life as a product chassis. Whole Life might be a complex product underneath, but it’s a very simple product to model. I wrote about this at length in #385 | Proof, Pudding by showing how it was easy to replicate the historical performance of a Whole Life policy over 40 years simply by knowing the expense spread and then applying the actual earned DIRs. If you know that a Whole Life policy has 1.5% in expenses over its life*, then you can roll the premiums and account value forward while applying the correct DIRs and you will get a final account value that is within spitting distance of what it should be.
In short, you can model it just like any other account that accrues in value over time. If you want to do that for Universal Life, you have to build a model that replicates the COI slope, expense load types and rates, crediting rates, Net Amount at Risk and corridor factors. Whole Life is much easier. You simply apply the appropriate expense deduction for the target year and then roll the account forward with the applicable premiums and DIRs. Voila. It’s a savings account inside of an insurance wrapper with a known cost and structure.
And what is the top-line earnings rate on the savings account? The DIR. Hence, the reason why the DIR is so helpful as a way to understand historical performance of Whole Life policies. DIRs are not, as we have shown, a “yield” on premiums placed into Whole Life because that explanation doesn’t account for expenses. But DIRs are also not “meaningless” because they are the top-line interest rate applied to the account value and, holding all else equal, will drive bottom-line performance. They’re the start of the calculation, not the end of it.
But they’re an essential starting point. At the heart of every life insurance policy is a very simple equation – premium minus expenses plus interest equals cash value. DIRs are the interest component and, therefore, should be reflective of the yields in the investment portfolio supporting the Whole Life block. That investment portfolio includes basic fixed income positions, but also equity stakes in the businesses owned by the insurer itself that can throw off outsized yields. MassMutual, New York Life, Guardian and Penn Mutual all have grown (or purchased) affiliated businesses that provide meaningful lifts to their DIR. Northwestern Mutual has taken a markedly different stance by focusing exclusively on participating businesses, although that’s potentially starting to change with the growth and profitability (presumably) of its broker dealer.
Decisions in the investment portfolio itself can also impact the path of the DIR. A company that has more short-duration fixed income will be more responsive to changes in interest rates and the opposite is true, generally, for a company with a lot of long-duration exposure. The same effect plays out with companies taking in a lot of premium relative to the size of the in-force block because all of that new premium is effectively ultra-short duration cash that has to be invested. Blend the affiliated equity, duration decisions and business mix together and you get markedly different paths for carrier DIRs over time. Take a look.
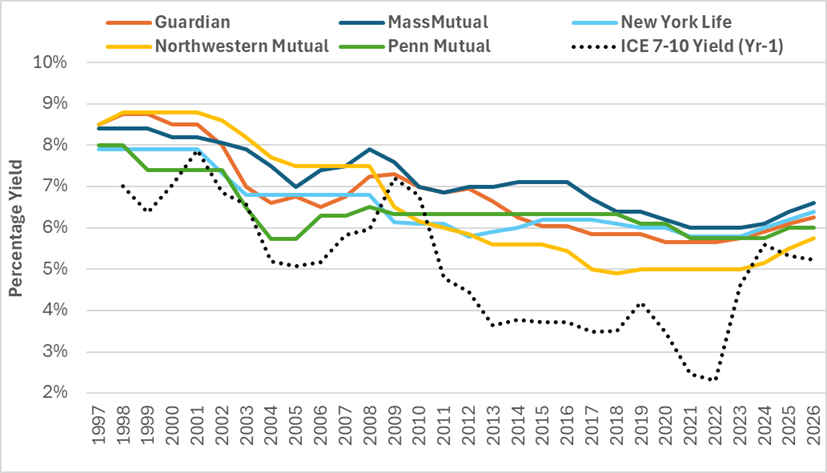
There are, I think, some pivotal moments on this chart. The first is 2001-2004, when corporate bonds – as measured by the ICE Corporate 7-10 Year Composite Yield with a one-year lag** – dropped from nearly 8% to 5%. Some carriers responded more quickly than others, likely because of holding more short-duration fixed income and new premium that was being reinvested at lower rates. Those same carriers also seemed to bounce back faster with consistently rising DIRs after 2004. This stands in contrast to Northwestern Mutual and New York Life, both of which had a more gradual reaction to falling and rising rates. Northwestern Mutual managed to hang on to the top DIR spot for almost a full decade from 1998 to 2007. It seems as though, for this period, that investment duration and new money flows were the biggest factors in the DIR paths of the various carriers.
The persistently falling rate environment after 2008 was, surprisingly, less damaging to DIRs. MassMutual and New York Life even increased DIRs at various points in that period and Penn Mutual stayed flat. The reason, it seems, has less to do with the investment portfolio and more to do with the growth in profitable affiliated businesses – most notably Oppenheimer and Barings for MassMutual and the annuities business for New York Life. But Penn Mutual was also feasting on growth in affiliated investment earnings in its Janney subsidiary and even Guardian was building substantial non-par businesses that staved off declines as well. If this regime was all about everything but fixed income, then the loser was predictably Northwestern Mutual, which doesn’t build non-participating businesses.
The trend, on average, is exactly what you’d expect. The path of DIRs across the industry broadly reflects the path of the expected yield on a mixed-duration portfolio that blends old investments with new. But the fate of each insurer’s DIR is dependent on its own decisions. It’s tempting to extend temporary phenomenon into eternity – because that’s exactly what happens on the illustration. During Northwestern’s decade of dominance, its products illustrated the best. Then came MassMutual and New York Life. Then came Penn Mutual. We can be entirely confident that the overall trend in DIRs matches more or less what you’d expect based on a simple model of what an underlying insurance portfolio should look like. And we can also be entirely skeptical of any claim that a carrier’s position will stay at the top or the bottom of the pack for more than a decade. The only constant is positional change. That much is obvious from even a cursory look at DIR histories.
But perhaps the most important period in this chart is the last 3 years. Coming off of a brutal and prolonged low interest rate cycle, the industry had one shot to prove that permanent life insurance products are what they say they are and do what they’re supposed to do. The mutuals have absolutely stuck the landing. Since 2022, DIRs are up 60bps at Guardian, New York Life and MassMutual – and 75bps at Northwestern Mutual. More importantly, the average DIR for all of the Big 4 + 1 mutuals sits at almost 1% higher than the 7-10 year corporate bond yield. It’s exactly what you’d expect to see if everything is working properly across the portfolios. It might even be better than what you’d expect to see, given that DIRs have averaged close to AAA corporate bond yields over the past 100 years.
This is a resounding affirmation of the underlying structure of the product and the willingness for mutual life insurers to pass strong results back to policyholders. The same can’t necessarily be said for companies selling Universal Life variants. Some companies are raising rates on in-force policies, some companies aren’t. But none of them have raised in-force rates as forcibly as the big sellers of Whole Life. The mutuals seized the moment to prove faith in participating Whole Life. Carriers selling Universal Life have generally not – other than to create new portfolios with higher rates that benefit only new policyholders.
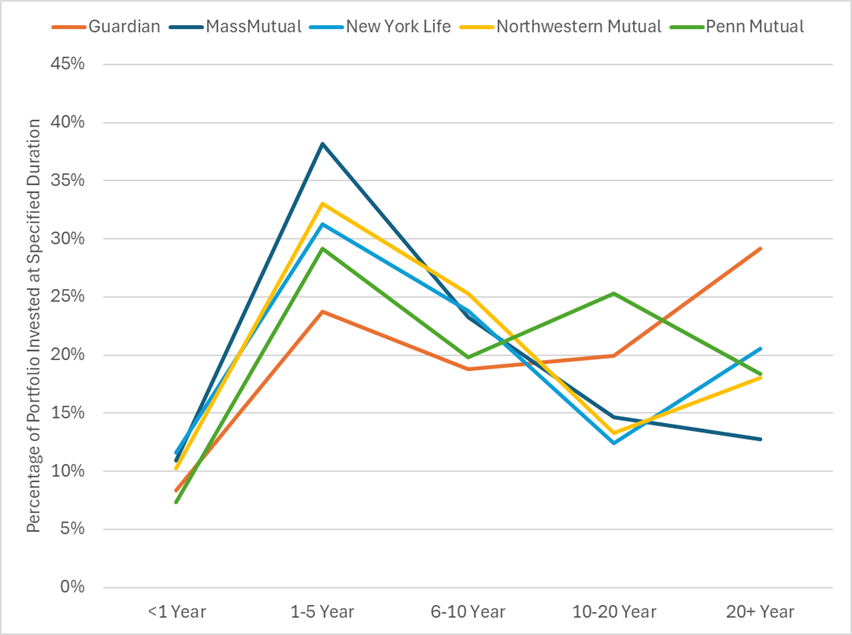
The ability for mutual companies to raise DIRs for Whole Life is also an indication that most of the insurers had some dry powder laying around in the form of short duration fixed income that can be reinvested. Take a look at each carrier’s percentage holdings of bonds with maturities of 10 years or less since 2015.
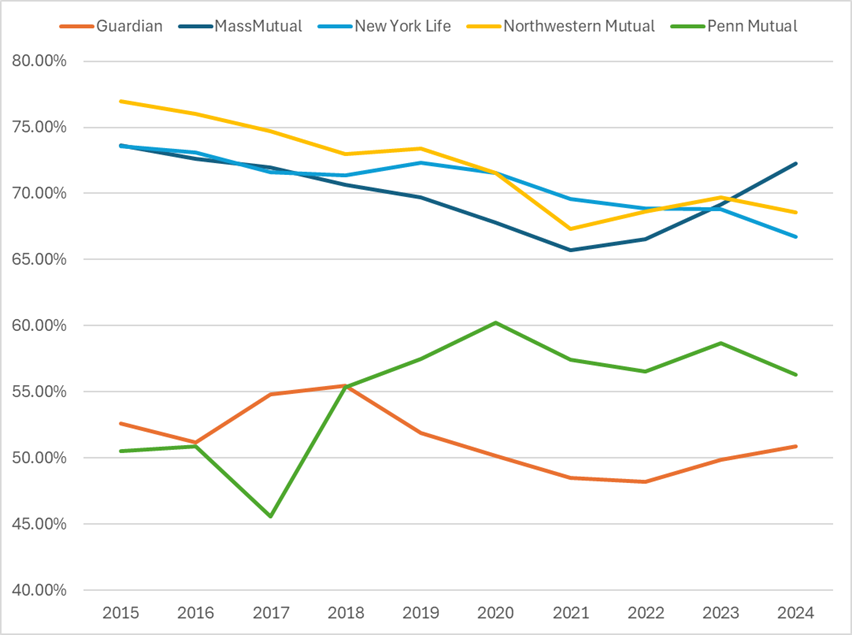
There was a marked push towards longer duration assets at most insurers through the prolonged low-rate environment, but some carriers were better positioned to take advantage of higher rates than others – most notably MassMutual, New York Life and Northwestern Mutual. Guardian, by contrast, had long pursued an investment strategy more focused on long-duration bonds. You can see this very clearly in 2022:
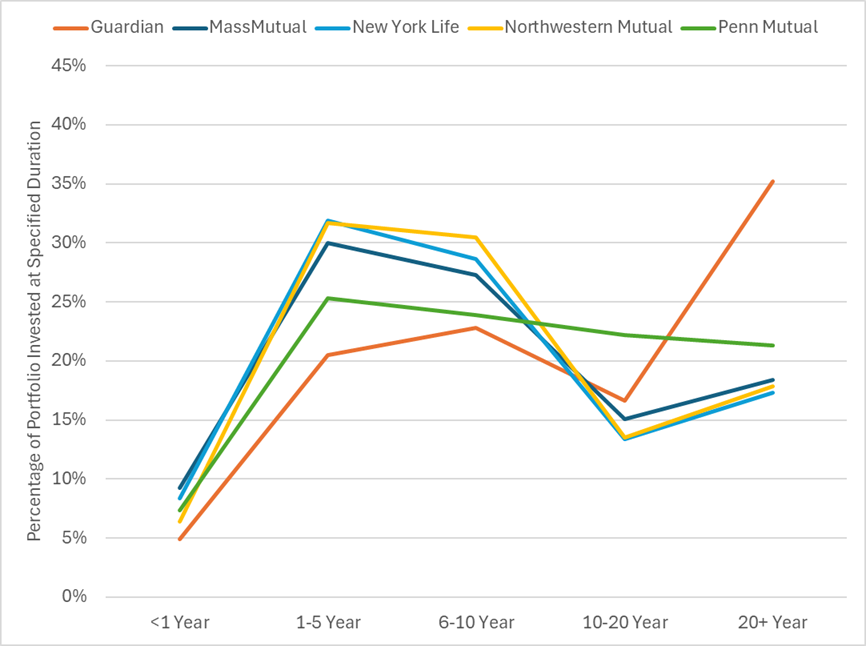
But by the end of 2024, Guardian had pivoted towards shorter-term investments. The same is true for all of the carriers across the board. Within the sub-10 year category, durations dropped. That makes sense considering the fact that the yield curve was heavily inverted. Going long on duration wasn’t a reward unto itself. Instead, choosing long-duration bonds would have implied a belief that interest rates were going to drop. That seems obvious now, but it wasn’t so obvious 24 months ago. Take a look at how the carriers compared at the end of 2024:
These decisions can have long-term implications for DIRs over the next decade. The carrier to watch, more than any other, is Northwestern Mutual’s. Not only does Northwestern Mutual have the largest Whole Life block, but its DIR is also the cleanest of the bunch because it doesn’t include any outside business earnings or affiliated equity stakes. It’s just a pure reflection of the underlying portfolio. The fact that Northwestern Mutual jumped by 25bps this year is an indication that the increase in DIRs is being driven by universal fundamentals, which Northwestern Mutual executes better than anyone, not strategy choices elsewhere.
The flip side is that the least indicative is arguably Penn Mutual, which has the smallest Whole Life block relative to other assets and historically has had a lot of noise from other earnings within the company. Penn Mutual’s DIR was flat. Combine that with the fact that all of the other carriers are up markedly less than Northwestern since 2022 and there is an argument to be made that what we’re actually seeing is a strategy regime change. From 2009 to 2021, outside business earnings and affiliated equities were a boon. Now, they seem to be something of a drag, or at least less important on a relative basis than they used to be.
But the big story is still a very good one – Whole Life from the big insurers is doing what it’s supposed to do. Dividend Interest Rates went up as interest rates went up. That is nothing but good news for policyholders. It’s proof that Whole Life deserves a place at the table as a fixed income alternative. It’s life insurance, yes, but all life insurance products are financial products and Whole Life is behaving like other financial products. Combine that with the inherent stability and security of the chassis and it’s a story worth telling.
*This only works for a point in time. Expense loading is obviously based on both assets and premiums, so you’d have to know the exact loading structure in order to line the numbers up perfectly in each year. But if you look at the illustration in year 50 (for example) and see a 1.5% IRR gap between DIR and IRR, then you can apply the DIRs along the way while deducting the 1.5% and you’ll get the correct cash value for that year. If the gap is 1.6% in year 40, then you will overestimate cash value in year 40 because you’re not using the correct deduction.
**The one-year lag allows for a clearer visual match between DIRs and corporate bond yields. DIRs are declared in advance, so the previous year’s yield is what feeds this year’s DIR. For example, DIRs in 2022 were informed by yields in 2021, which is why we didn’t see a pickup in DIRs until 2023.