#385 | Proof, Pudding

I’ve decided to make this article free for everyone, but you’ll note that it’s #385 – which means that there are 384 other articles on the site that are available only to subscribers. This one is par for the course of what subscribers to The Life Product Review get in their inbox literally every single week. If you enjoy it, consider supporting the publication by subscribing. You can find the link in the top right corner of the page under “Join.”
Full Article
The single question that most bedevils the life insurance industry is the one that should be the easiest to answer – does it actually work? There is no small bit of skepticism in the broader world about life insurance. I see this most pointedly on the text chain with my college buddies who regularly refer to life insurance products as a “scam,” think of life insurers as “Ponzi schemes” and, my favorite, screenshot memes from Twitter accounts about people over-selling Whole Life to unsuspecting victims. They do it because, like any real friends, they enjoy the sport of relentless mockery and life insurance is an easy target. But they also do it because they suspect their characterizations and accusations might be at least somewhat true. And I don’t think they’re the only ones.
We, as an industry, do a terrible job of building basic trust in our products and the companies that sell them. Take something as foundational as death claims. In the second episode of the smash-hit Ozark series on Netflix, the main character – Marty Byrd – owes $8 million to the cartel and sees life insurance as a way out, not for him but for his family. Marty asks his lawyer “how often carriers deny claims if there’s any suspicion that the policyholder has committed suicide” and his lawyer informs him that “if it’s an individual, any death is going to be investigated…that’s all ammunition that an insurance company is going to use to try to not pay out.”
Marty hangs up, sighs deeply, and then sets off on four seasons of death and destruction that all could have been avoided simply by his lawyer giving the correct answer about contestability periods and the fact that life insurers only investigate death claims if there is a suspected misrepresentation on the original application. But then humanity would have been deprived of Ozark. We can’t let obscure life insurance facts get in the way of riveting TV, can we?
Making the (Flawed) Case Against Permanent Insurance
Most of the skepticism about life insurance, however, is pointed towards the cash accumulation features of permanent life insurance policies. Dave Ramsey is probably the well-known skeptic of Whole Life and he articulates his point of view in this YouTube clip. At the core of his argument are three things that he states as fact. First, Term insurance is much cheaper than Whole Life. This is true. If cost is the only metric, then every client should be in One Year Term (OYT). The most efficient way to do life insurance, therefore, is to buy OYT and invest the difference.
But the problem with OYT is that the cost increases over time. Why? Because that’s the shape of the mortality slope that underpins all life insurance, including OYT. As a result, the key function of a life insurer is to levelize a non-level cost – in other words, to offer policies with level premiums. Policyholders overpay early so that they can underpay later. The overpayments are then held as a reserve. That’s as true for 10 Year Term as it is for Whole Life. The difference is that the reserve is not liquid in Term but it is liquid, as cash value, in Whole Life.
This leads us to Ramsey’s second point against Whole Life, which is that the policyholder receives only the death benefit and not the cash value upon death. In his words, “when you die, they keep your money…you never get both [the death benefit and the cash value] but you’re always paying for both.” If this was true, it would make for quite a salacious story. It’s one of those things that is proof positive, if it were true, that whole life is actually a scam. But it’s not true. Not even close.
The basic mechanics of any fixed permanent insurance policy are that premium is paid, policy charges are deducted and the remaining amount earns a stated interest rate. In Whole Life, the policy charges and stated interest rate are guaranteed. The premium is calibrated so that the cash values grow every year on a guaranteed basis to eventually equal the death benefit at the stated maturity age for the contract, usually age 100 or 121. Here’s what the relationship looks like over time:
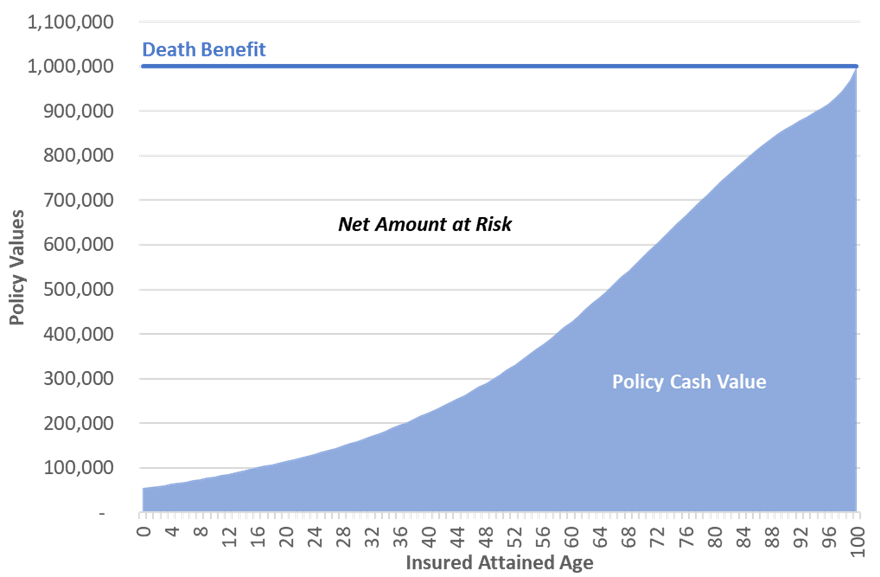
Ramsey is right that the policyholder receives the death benefit, not the death benefit plus the cash value. But he is dead wrong about the idea that the policyholder is “always paying for both [death benefit protection and cash value].” Cost of Insurance charges are based on the Net Amount at Risk, which is – by definition – the difference between the death benefit and cash value. That’s true for all types of life insurance including Whole Life, which embeds the charges in the calculation of the guaranteed premium. Policyholders only pay insurance costs on pure insurance coverage, which is Net Amount at Risk, not the total Death Benefit.
Net Amount at Risk shrinks over time as the cash value grows underneath the level Death Benefit. The hilarious irony of this mechanical aspect of a permanent life insurance policy is that it perfectly conforms to Ramsey’s view of life insurance needs. One of Ramsey’s arguments in the video is that people “don’t really need insurance for [their] whole life.” His point is that life insurance needs eventually shrink over time and, therefore, Term is the better option. Maybe. But guess what else naturally shrinks its pure insurance coverage over time? Whole Life.
These points are not a matter of subjective opinion. They are the essential laws of the life insurance universe. Mortality costs increase with age. Life insurers and their products exist to levelize non-level mortality costs. The difference between premiums paid and the actual underlying mortality cost represents a reserve that earns interest. With Term, the reserve is not liquid and is chewed up by the end of the term by mortality. With Whole Life, the reserve is liquid in the form of cash values. The premium for Whole Life is calculated based on guaranteed fixed charges, guaranteed cost of insurance charges assessed on Net Amount at Risk (not the Death Benefit) and the guaranteed interest rate such that the cash value equals the death benefit at policy maturity. That’s it. That’s the whole story. That’s how life insurance works.
Does Permanent Insurance Actually Work?
What is a matter of subjective opinion, however, is whether Whole Life is actually a good deal. Dave Ramsey has an opinion on this as well, declaring that the “average rate of return…if you look at your actual cash value build up…ends up being an average of about 1.2%.” He doesn’t source the number but I think I know where he’s getting it – non-participating Whole Life. I ran a Nationwide non-par Whole Life 100 policy and the long-term guaranteed IRR on cash value is, in fact, about 1.2% for a 45 year old policyholder. This makes sense. The returns in non-par Whole Life are based solely on the tabular guaranteed premium based on guaranteed charges and credits.
With the exception of Final Expense, non-par Whole Life is a vanishingly small piece of the Whole Life market. The vast majority of sales are participating Whole Life that, unlike non-par Whole Life, participate in the profits of the Whole Life block and the issuing (mutual) insurance company. Whole Life blocks fundamentally make profit by having better mortality than the guaranteed rates, lower expenses than the guaranteed expenses and higher investment returns than the guaranteed crediting rate. All of those line-items – plus potentially a share of the overall profits at the (mutual) life insurer from other activities – tally up to the dividend that is paid to policyholders.
Most policyholders elect to receive the dividend as a Paid Up Addition that buys additional guaranteed death benefit that has its own guaranteed cash values and receives its own dividends. In other words, dividends are additive to policy cash value performance and increase returns. As I argued in a recent 3-part series, the long-term performance of a participating Whole Life policy should look a lot like the net returns of the underlying investment portfolio at the life insurer after accounting for policy expenses related to commissions, insurer taxes, overhead and the pure insurance coverage.
However, the life insurance industry has done a terrible job of proving that policies actually perform as they should. There is no external benchmark for Whole Life performance over time, for example. Why not? Because these policies are owned by individual policyholders – and individual policyholders aren’t uniform. Some neglect to pay premiums. Some take policy loans. Some repay policy loans. Some take partial surrenders. Some exchange their policies to new policies.
Creating an external benchmark of policy performance would require the perfect policyholder who did everything exactly by the book and kept the policy for several decades. And then you’d have to convince the policyholder to share their policy for the purposes of maintaining the external benchmark. In short, creating an external benchmark for long-term policy performance is an exceedingly tall order with no economic model. Hence, the reason it doesn’t exist. That’s also the reason why skeptics like Dave Ramsey fill the informational void with what amounts to little more than conjecture. And I can’t say that I blame them.
The Perfect Case Study
Fortunately, I know one of those perfect policyholders. He’s in my family. He’s owned his $200,000 Northwestern Mutual Select 100 Whole Life policy since September 28th of 1988. He has paid his $2,072 annual premium every year except for 2006 when he was between jobs, making the natural jump from selling narrow fabric (specifically lace for women’s undergarments) to commercial construction. He has never taken a surrender or a policy loan. And he even kept the original proposal packet and illustration shown by the agent back in 1988. My jaw dropped when I saw it.
The agent, a Northwestern Mutual representative in Charlotte, made a textbook pitch for life insurance that wears as well now as it did back then. It revolved around three key points. First, the quality of Northwestern Mutual as a life insurer, highlighting (literally) that “Northwestern is a mutual company” and stating some basic facts such as assets ($22.6B), dividends ($1.2B), policies (3.3M). There’s also a piece entitled “Where Did The Money Go?” that compares the top 20 mutual companies of the time and how they perform on mortality, expenses, interest and, ultimately, paid dividends to policyholders.
The second point was around positioning of life insurance as a bedrock financial planning asset with tax advantages in light the tax reform movement of the mid-1980s. The pitchbook has a financial pyramid with life insurance at the bottom and scaling all the way up to exotic assets like art and gems – which actually seem pretty tame considering that a pyramid for today’s assets would probably have NFTs and crypto at the top. Several pages of the pitchbook are dedicated to contemporary newspaper clippings showing credible third-party publications talking about how life insurance was, at the time, the last great way for policyholders to control their tax incidence. The point is encapsulated in a bold statement at the bottom of one page – “it is a paradox that in the world’s richest nation, millions of people live in poverty. These people didn’t plan to fail…they failed to plan.”
The third point was to make the simple case for Whole Life over Term, as encapsulated in the hand-made graphs and bullets below. Take a look:
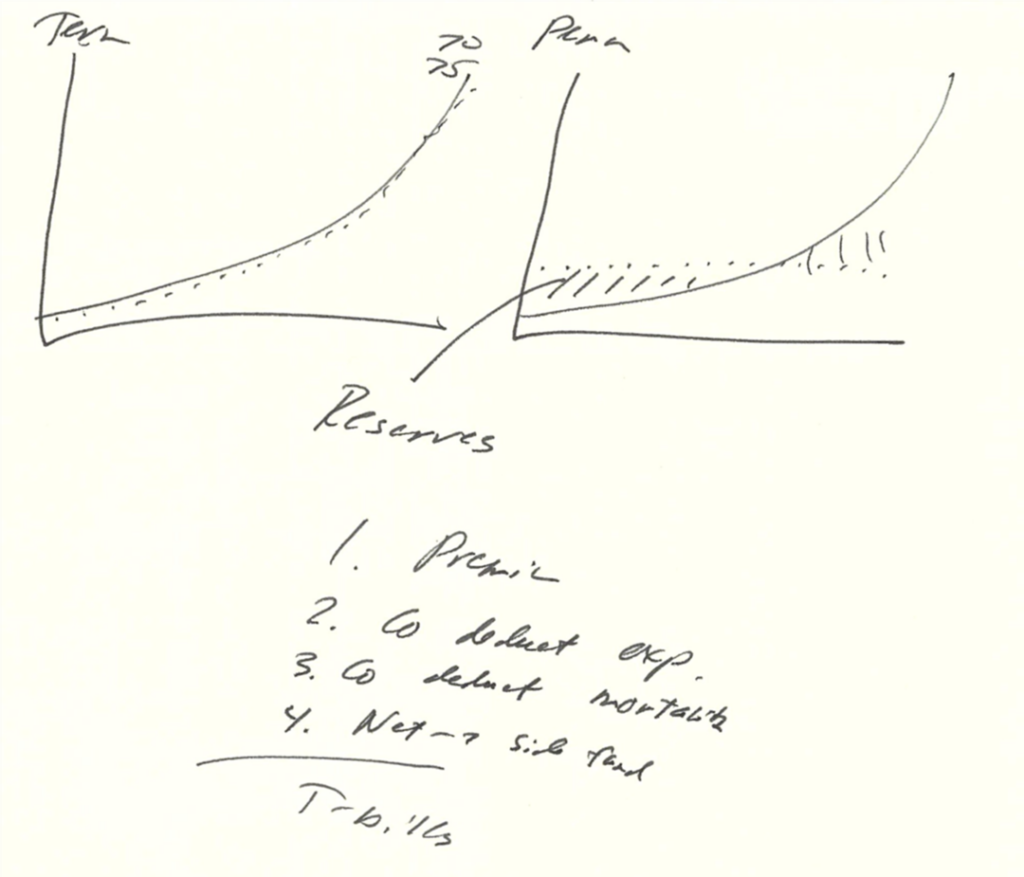
You can see exactly how the story is framed. One-year Term – level Term didn’t really exist back then – is cheap but gets expensive. Whole Life levelizes the cost. The difference is held as a reserve. How is the reserve calculated? Premium goes in, expenses go out, mortality costs go out and what’s left over is the side fund, the cash value. What does the cash value earn? You can see it right below: “T-bills.” The insinuation being, of course, that the return on Whole Life over time looks more or less like Treasuries. This is a perfectly distilled encapsulation of the universal laws of life insurance mechanics. Hats off to this agent. I wish everyone told the story this clearly, concisely and intuitively.
Actual Policy Performance
Now, to the real question – how has this policy performed? Let’s start by looking at the original illustration:
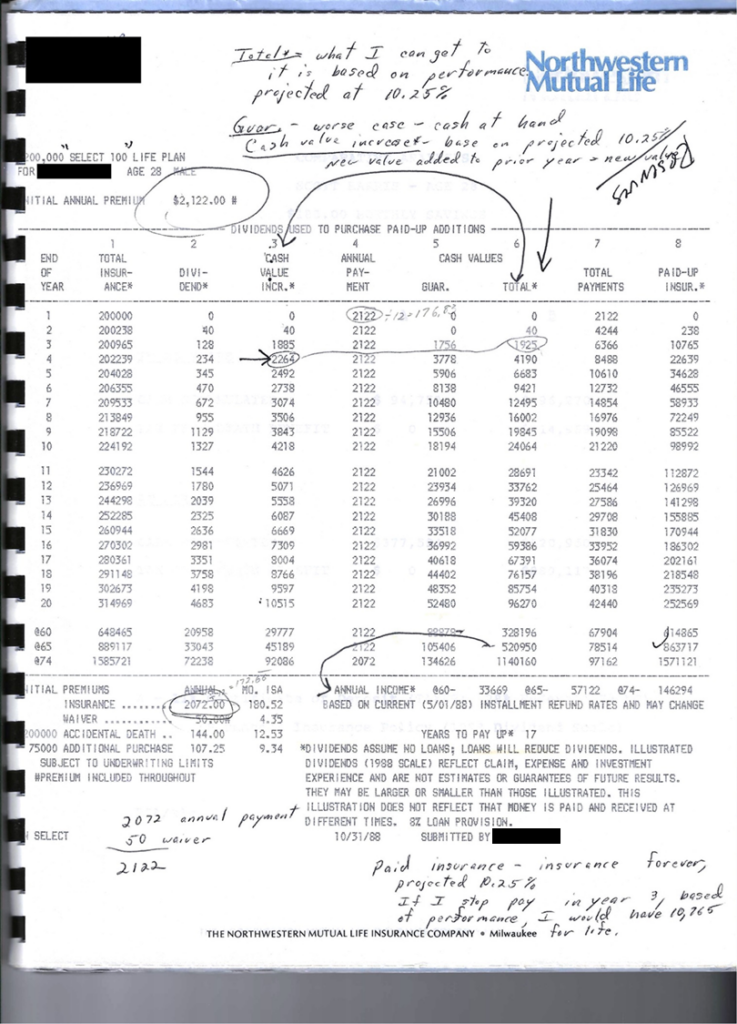
The original illustrated dividend rate was the 1988 scale – a whopping 10.25%. At his age 65, which is just two years from now, he was originally “projected” to have $520,950 in cash value that would, based on the annuitization tables at the time, have generated $57,122 of lifetime income. If my family member understood this illustration to be a projection of future performance and was relying on the illustrated $57,122 of lifetime income, then he would be exceedingly disappointed with this policy. But he isn’t. He’s actually thrilled with it. Why? Because he actually understood how it worked.
I think it’s worth pausing here to point out that there are a lot of policies written around the same time that have been horror stories for policyholders. Why? Because those sales were dependent on illustrated performance. This sale wasn’t. This was not a Universal Life policy illustrated at 10.25% in order to reduce the initial premium. This was not a Whole Life policy sold under the assumption that dividends would quickly offset premium requirements. This policy was not sold on the promise of enormous future illustrated income. Instead, was a classic Whole Life fixed premium sale with the potential for upside from dividends. The sale was about the protection and the value of the product, not the illustrated performance. And that made all the difference.
As interest rates declined, so did Northwestern Mutual’s declared dividend interest rate. Here’s what happened to the DIR in the years after 1988:
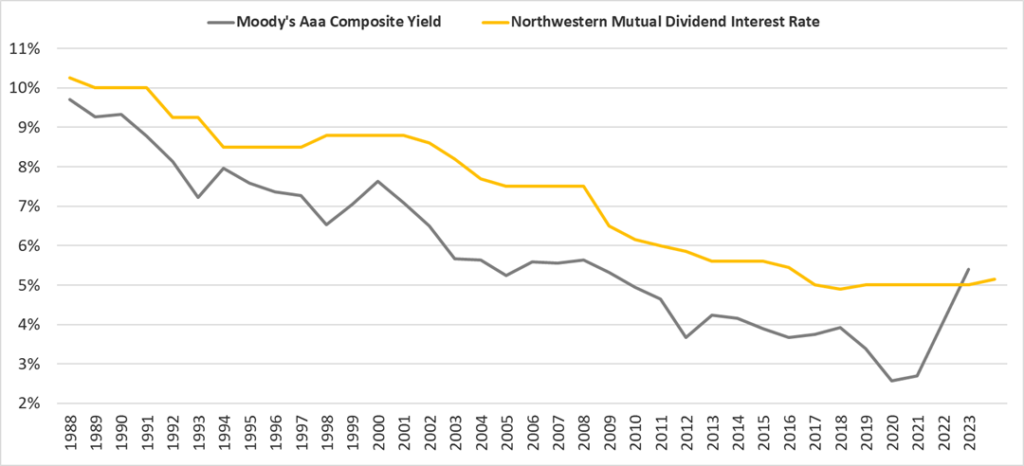
The real question, then, is not whether this policy lived up to the projection of 10.25%. It didn’t and it shouldn’t have. In situations where illustrated performance was the focus, then the declining dividend rate represents “failure” of the plan. But that’s exactly how the policy is supposed to work. The logic behind any Whole Life policy is that the DIR should reflect the return on the underlying investment portfolio of the life insurer. If yields are dropping, then – actually – the DIR will be higher than new money yields on comparable corporate bonds. But ultimately, the DIR will decline with market interest rates. That isn’t underperformance. That’s proper performance.
The real question is whether the policy did what it was supposed to do in terms of returns. The original illustration showed an IRR on cash value of 8.55%, which is 1.7% less than the Dividend Interest Rate of 10.25%. The difference represents the policy expenses and mortality expenses. It’s worth noting that this policy isn’t so different from contracts issued today. I ran a modern Whole Life Pay to 100 contract with a 3.75% guaranteed rate on a 28 year old Preferred Male for a $200,000 death benefit and the premium was $2,092, just $20 more than the price of my family member’s policy (excluding the waiver of premium). On top of that, the drag from expenses and mortality in the modern Whole Life was around 1.9% to Age 65. The original contract, in other words, was priced efficiently – even by today’s standards.
If the policy was performing as expected, then that same 1.7% difference between the Dividend Interest Rate and the cash value IRR should have held up since 1988 even though the DIR declined throughout the period. I built an Excel model that replicated the original illustration and then replaced the annual cash flows from the interest component with the actual Northwestern Mutual DIR over time. If this policy was doing what it was supposed to do, then the actual cash value should look very, very close to what the model would spit out with the same expense ratio over time. So did it?
You bet it did. The modeled cash value for the policy anniversary in 2023, including the missed premium in 2006 that was covered by the dividend, was $188,536. The actual cash value in the most recent policy statement was $188,939.56, a difference of $403. In short, this policy did what it was supposed to do. Exactly what it was supposed to do.
Just for fun, I decided to put the agent’s “T-Bills” scribble to the test. I pulled data on 10 Year Treasury total returns stretching back to 1988 to see what would have happened if, instead of buying Whole Life, my family member would have actually invested in Treasuries* – without incurring any taxes, without deducting the cost of insurance and without paying any fees to an advisor. Even with those massive advantages in the analysis, Treasuries come up short, delivering just $155,029 in value as of 2023. You’d have to reach all the way down to Baa bonds to get after-tax, after-fees and after-insurance returns that are comparable to Whole Life. This policy delivered the goods over 35 years as a no-risk, fixed income alternative.
I don’t think this story is unique to my family member or to Northwestern Mutual or arguably even unique to Whole Life. This is proof that the universal laws of insurance apply and that they produce the intended and expected results over the long-run. I’m not talking about illustrated performance. That is meaningless. I’m talking about the fundamental characteristics of permanent life insurance and its ability to deliver consistent cash value returns to policyholders that reflect the life insurer’s underlying portfolio. As long as the insurer is well managed, then these policies do what they’re supposed to do. The performance proof is in the policy pudding.
*Data sourced from pages.stern.nyu.edu/~adamodar/New_Home_Page/datafile/histretSP.html