#415 | Penn Mutual Plays for Keeps

Summarized by ChatGPT
Penn Mutual ranks as a mid-sized player in the Whole Life market, positioned 10th in sales, significantly trailing behind competitors like Guardian and OneAmerica. Despite this, it maintains a strong presence in niche markets and among high-end producers, thanks to its competitive products and solid reputation.
In 2023, Penn Mutual launched two new Whole Life products: Protection Whole Life, focusing on death benefits with lower premiums, and Accumulation Whole Life, aimed at accumulation with higher premiums but superior illustrated performance [Chat GPT was not correct – PWL came in 2023, AWL in 2024]. This strategic move followed competitors’ dividend increases, which initially threatened Penn Mutual’s lead in the accumulation space.
The company increased its Dividend Interest Rate (DIR) to 6%, enhancing the appeal of its products. Its aggressive investment strategy, particularly in Schedule BA assets, contributes significantly to its competitive edge, resulting in high net investment income.
However, questions arise about the sustainability of its performance amidst its reliance on exotic investments and whether it can maintain its advantage as it grows. Ultimately, while Penn Mutual’s products are compelling, the focus for prospective buyers should remain on the company’s fundamentals rather than short-term performance metrics.
Full Article
By virtually any metric, Penn Mutual is a mid-sized player in Whole Life. Data released by LIMRA places Penn Mutual at 10th place in Whole Life sales through the second quarter of this year, running nearly 10% behind OneAmerica and a whopping 65% behind Guardian, the nearest Big 4 Whole Life competitor. Guardian’s Whole Life block delivered $5 billion in premiums on $50 billion of Whole Life reserves in 2023. Penn Mutual collected $672 million on $8 billion of Whole Life reserves. To put that into context, Penn Mutual is bracketed by PacLife with $10.8 billion and John Hancock with $6.4 billion in Whole Life reserves and neither of those companies actively sell participating Whole Life policies.
But Penn Mutual looms large in certain corners of the market, particularly within high-end producer groups such as Lion Street and FFR and in geographic locales where Penn Mutual has historically had a strong presence through career agencies and/or regional offices. There, it feels like Penn Mutual is almost on equal footing with the Big 4. Penn Mutual sports sterling ratings, a market-leading underwriting program called ACE, competitive compensation, big-company resources such as a real Advanced Sales department and a 175-year history as a true-blue mutual company. Penn Mutual is the peacock of the Whole Life market. What it lacks in size, it makes up for in pure presence, vibrant color and a big shadow.
And, of course, wickedly competitive Whole Life products. Penn Mutual uses a single product chassis with a 3% guaranteed interest rate, Guaranteed Whole Life II, for all premium payment periods. It was originally positioned in the wake of the changes to 7702 in 2021 as an all-rounder product that could compete on both protection and accumulation-oriented sales. Being good at a lot of things but great at nothing is theoretically a vulnerability, particularly as Penn Mutual’s competitors almost universally stratified their product offerings to focus on specific markets and sales strategies.
What might have been a vulnerability for other companies proved to be a strength for Penn Mutual. Guaranteed WL II was incredibly competitive for both protection and accumulation. MassMutual, for example, rolled out its WL 100 product with a 3.75% guaranteed interest rate and yet Penn Mutual still offered cheaper premiums on Guaranteed WL II for the same payment duration. MassMutual also released a 10 Pay with a 2% guaranteed interest rate in 2021 and Penn Mutual still managed to beat it in terms of illustrated performance with Guaranteed WL II while offering substantially cheaper premiums and, therefore, better guaranteed values. Penn Mutual turned the typical Whole Life logic on its head with Guaranteed WL II. The net result? A colossal 86% increase in sales from 2019 to 2021, double MassMutual’s growth over the same period.
However, the dynamic shifted a little bit in 2023. Northwestern Mutual, New York Life, MassMutual and Guardian all raised dividends by 10-15bps for 2024 but Penn Mutual held steady at 5.75%. At the same time, Penn Mutual raised the premium load on Paid Up Additions, which cut into performance on certain accumulation designs. The net effect was that, for the first time in years, the accumulation offerings from those companies were nipping at Penn Mutual’s heels in terms of illustrated performance.
The solution came in two acts. The first act was the release of Protection Whole Life in April of 2023. The product uses a 3.75% guaranteed interest rate and is clearly focused on minimizing premiums for protection-oriented sales. The net effect is double-digit decreases in premiums while still maintaining compelling cash value performance. I ran a 45 year old Preferred male for $100,000 annual premiums and Protection Whole Life had a 25% higher death benefit than MassMutual with only a slight lag in cash values. Protection Whole Life is clearly designed to appeal to the small subset of Penn Mutual’s producers who sell Whole Life primarily for death benefit protection.
More importantly, Protection Whole Life opened up real estate for the second act – Accumulation Whole Life, which was released a couple of weeks ago. It uses the same filing and 3% guaranteed rate as Guaranteed WL II, but with higher premiums and stronger illustrated performance. Much stronger illustrated performance. Accumulation Whole Life tacks a little over 40bps of additional cash value IRR on Guaranteed WL II, which was already neck and neck with Mass Mutual and New York Life for the best illustrated performance in the industry. It’s a huge leap forward for Penn Mutual.
So where did that 40bps of improvement come from? The biggest chunk is what a Star Trek fan might refer to as a “temporal anomaly.” Concurrent with the release of Accumulation Whole Life, Penn Mutual announced a 0.25% increase to its Dividend Interest Rate for 2025, bringing the rate to 6%. Accumulation Whole Life illustrates 6% but Guaranteed WL II illustrates 5.75%. That extra 0.25% flows directly into product IRR. Penn Mutual actually automatically kicks out a supplemental illustration with a 0.25% reduction in the illustrated dividend, which makes the comparison between Accumulation Whole Life and Guaranteed WL II very easy. Take a look below at the cash value IRRs over time comparing the two products:
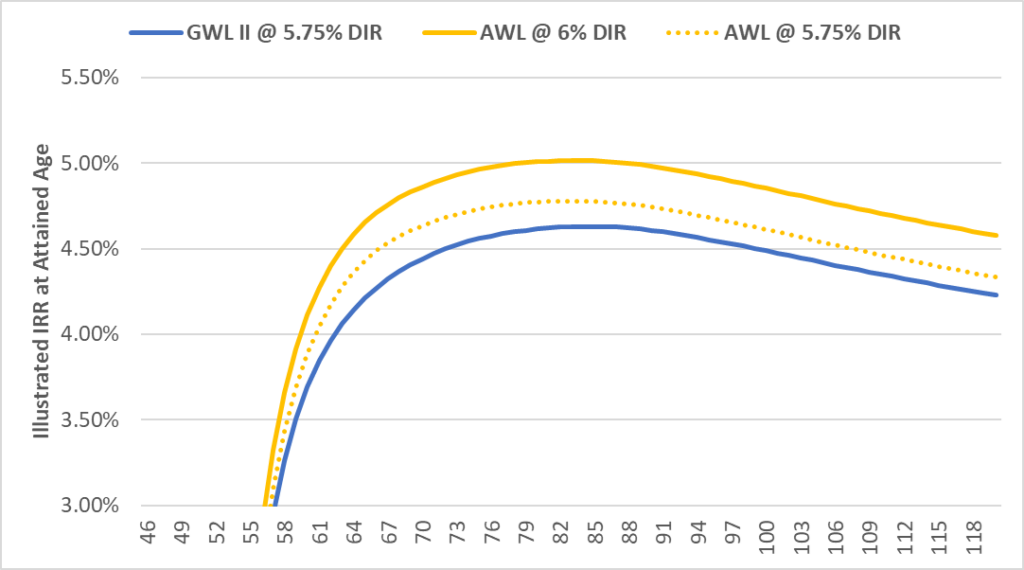
Accumulation Whole Life still has the edge after accounting for the extra 0.25% in dividends, but it’s trimmed down to something more like 15bps. Sourcing that edge is quite a bit trickier. When I initially approached the two products, my assumption was that the increase in price for Accumulation Whole Life also resulted in lower earlier values from higher policy charges that were then funneled back into the product via better long-term performance. You can kind of see this playing out in what I refer to as the “imputed crediting rate” for the policies. I basically applied a 2017 CSO Preferred mortality table to the product and then solved for the crediting rate to match the policy cash values after the end of the 10 year premium payment period. It’s the same basic idea as looking at year-over-year cash value growth, but with a bit more accuracy because it takes COI charges into account. Results are below.
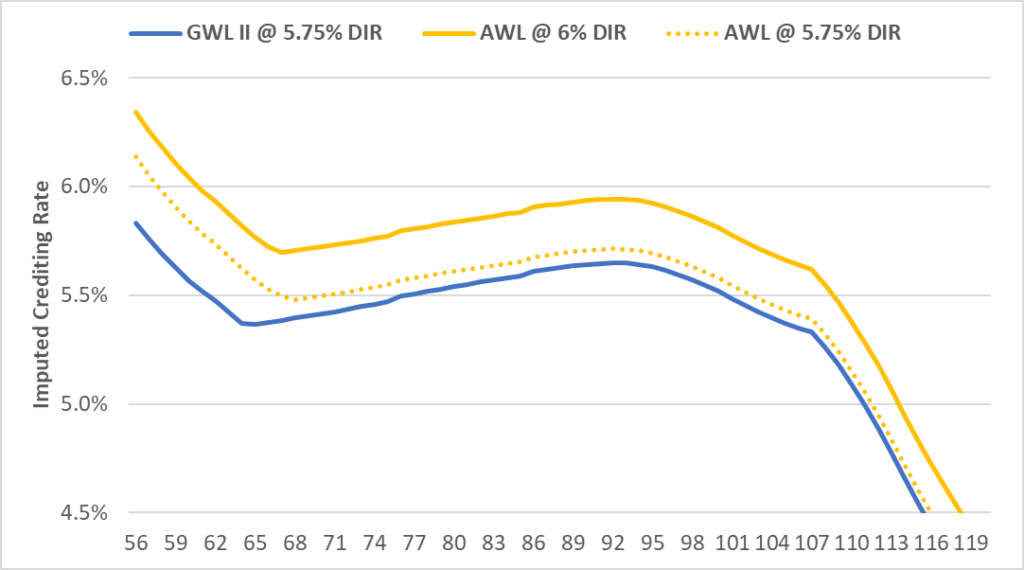
GWL II and AWL are nearly identical when run at the same 5.75% Dividend Interest Rate except for years 11-22. The difference during those years averages 25bps in favor of Accumulation WL, but then it falls to a fairly stable 7bps for the remaining life of the policy.
So what’s the tradeoff? Theoretically, a more expensive Whole Life policy should have the edge over a less expensive one for accumulation. Lowering the death benefit in a Universal Life policy makes the contract marginally more efficient primarily because it lowers commissions and only secondarily because it reduces initial Cost of Insurance charges due to a narrower Net Amount at Risk. Lower commissions in Universal Life results in lower policy charges related to commissions, which are by far the largest single policy charge line item in the first 10 years of a Universal Life policy. But Accumulation Whole Life pays basically the same commissions as Guaranteed WL II.
The only real difference between the two products is on guaranteed cash value materialization. All Whole Life policies have endow at maturity, meaning that the cash value has to equal the death benefit. A lower death benefit means that guaranteed cash values accrue more slowly. How do you get guaranteed cash values to accrue more slowly? By whacking premiums with expense loads. The lower the death benefit per dollar of premium, the higher the expense loads.
That dynamic plays out in the comparison of these two products. In year 10, Guaranteed WL II had $923k of cash value for this cell compared to just $835k for Accumulation WL. I did a back-of-the-envelope calculation to scrape out the guaranteed cash values because we know the mortality table and the 3% interest rate. The difference is huge – Guaranteed WL II has imputed policy charges of something like $177k compared to $255k for Accumulation Whole Life. It seems like that’d be a source for some of the later performance in the contract, right? That seems logical.
But it’s not what actually happens. Instead, Accumulation UL materializes more cash value than Guaranteed WL II at every duration even when the two products are illustrated with the same 5.75% DIR. The cash value for GWL II in the first year is zero, but Accumulation WL has cash value thanks to a first-year dividend payment, which is something I haven’t seen in a Penn Mutual policy, maybe ever.
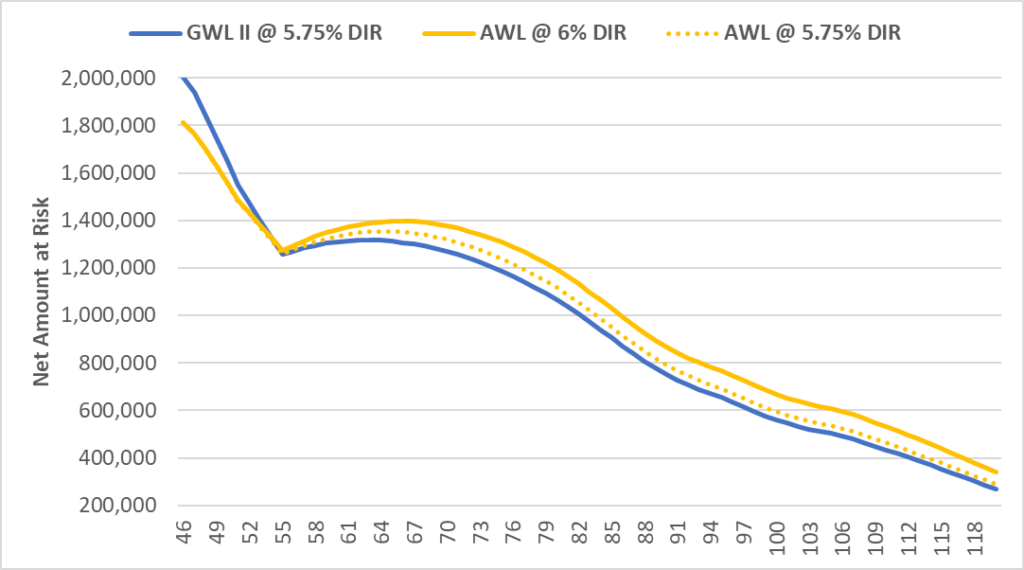
Accumulation WL also, surprisingly, has a higher average Net Amount at Risk – as in, more actual death benefit – than the outgoing product over the life of the contract. How is that possible? Both products have a 3% guaranteed interest rate and, therefore, the same cash value corridors. But since Accumulation WL has better illustrated performance, it also carries more Net Amount at Risk over time even though it starts out with less. You can see that dynamic clearly playing out below with numbers pulled straight from the illustrations.
The more I think about this, the less it makes sense. There might be a technical argument that Accumulation Whole Life is more expensive than Guaranteed WL II, but that’s only true for guarantees. On a current basis, Accumulation WL is richer in terms of early cash values and carried Net Amount at Risk through the life of the contract. The only visible tradeoff is a very slight drop in Target premiums – a small price to pay for a 10-15bp improvement in long-term performance.
The real story for Accumulation Whole Life, however, isn’t the product. It’s the fact that Penn Mutual increased its Dividend Interest Rate by 25bps to 6%. Between the increase in the dividend and the increased performance of the product, Accumulation Whole Life is the new benchmark for accumulation-oriented products, smoking its closest competitors by 35-40bps. Penn Mutual is playing for keeps.
How do they do it? There are only so many ways to be competitive in Whole Life. Nothwestern’s strategy, as far as I see it, is to nail the basics – low expenses, low mortality, high investment yields. MassMutual and New York Life’s strategy is to essentially reinvest capital into business that spin off earnings for future benefit, essentially investing in the equity of non-participating business lines. Those excess earnings show back up in the dividend over time. MassMutual’s calling card for success in that strategy is Oppenheimer Funds (and the sale of that business to Invesco) and New York Life can point to its massive earnings coming from its stock subsidiary, New York Life and Annuity Company.
Penn Mutual, however, seems to be taking a page from both books. It is one of the more aggressive investors in our space, with an allocation to Schedule BA assets – essentially less liquid, equity and equity-like assets including partnerships in hedge funds and private equity – that is rivaled only by John Hancock. Schedule BA assets make up more than 11% of PennMutual’s total invested assets and yielded a whopping 9.8% in 2023. Its $14.7 billion bond portfolio, by contrast, threw off a 4.45% yield. A little less than half of the value of the Schedule BA assets held on Penn Mutual’s balance sheet are affiliated investments and a significant portion of that is Janney Montgomery Scott, which KKR agreed to buy in July for an undisclosed price that we will probably be able to see in the Q3 or Q4 statutory filing.
Penn Mutual also writes non-participating policies that theoretically accrete benefits to participating policyholders over the long term. Whether those policies have actually been profitable is not entirely clear. Penn Mutual’s primary driver of earnings in annuities is an old Variable Annuity block with living benefits. On the Life side, Penn Mutual categorizes its Indexed UL product as a Secondary Guarantee contract – I’m not entirely sure why – and the business line appears to break even at Penn Insurance and Annuity Company, a writing subsidiary of Penn Mutual Life. But Penn Mutual also has a $2.5 billion Guaranteed UL block that is reinsured through Penn Insurance and Annuity Company to a Delaware captive that has around $115 million of statutory capital. What are the real economics of that block? Who knows. Plenty of other companies have taken a beating on their Guaranteed UL blocks but not Penn Mutual. At least, not yet.
Penn Mutual is also a relatively small company and that makes it difficult to operate at scale for expenses. Take a look at the chart below, which compares the net investment earnings attributed to the Whole Life block to the expenses attributed to the Whole Life block, both using Whole Life reserves as the denominator. The little white dot is the net percentage.
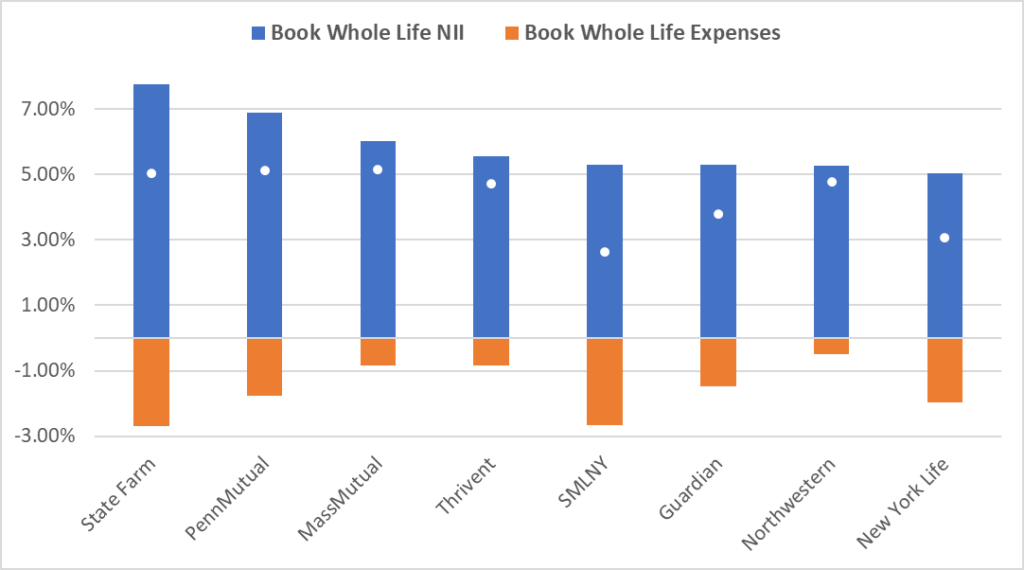
These figures are not perfect. Attribution of expenses and investment income varies by carrier and, even then, individual company comparisons can be off. A couple of years ago, for example, NYL had an enormous NII percentage because of gains from some particular trades that got amortized. New York Life also runs an agency management system that routes those expenses through the home office, so its expense ratio is high but its commission ratio as a percentage of reported sold premium is low (82%) versus companies that use a true General Agent system where the ratios are much higher (such as 140% at Northwestern Mutual). So take these figures with a grain of salt.
That said, Penn Mutual has consistently knocked it out of the park on Net Investment Income. My interpretation of their DIR – which is somewhat confirmed by reverse engineering their product as described above – is that it’s more “pure” than some of the other insurers. When you see a Guardian DIR, for example, there is a load applied to the DIR before it actually hits the policy cash values. These sorts of loads can range from 1% to 0.25%, depending on the product. Penn Mutual is at the lower end of that scale and Northwestern Mutual is even lower. Northwestern Mutual covers expenses through high product pricing rather than a cut of the DIR. Their NII was 5.27% for 2023 and the Dividend Interest Rate was 5.15%*, virtually all of which flows through to policy values as a crediting rate**.
Penn Mutual’s products, however, are cheap. It looks to me like Penn Mutual essentially deducts its expenses before reporting its DIR. So although it has a 6.9% statutory NII, it essentially takes a spread and then reports the DIR. If that’s correct, then its reported DIR of 5.75% – now 6% – is much more powerful than the reported DIR at other carriers. And that’s what we see in the net result in terms of illustrated performance. Penn Mutual’s products have higher illustrated performance with a lower DIR. The only explanation is that Penn Mutual is quoting a post-expense DIR whereas other carriers with higher DIRs are quoting a pre-expense DIR. If Penn Mutual quoted their DIR like everyone else, it would probably be closer to 6.9%.
The story, then, is not that Penn Mutual’s DIR is at 6%, it’s that Penn Mutual increased its DIR and therefore the new Accumulation Whole Life product looks fantastically competitive. It’s like staring into the future after all of the other insurers publish their DIRs. And that future is coming fast. Just last week, Northwestern Mutual also announced its dividend – a whopping $8.2 billion compared to less than $300 million for Penn Mutual – and increased its DIR by 35bps to 5.5%. That is massive and it vaults Northwestern Mutual to illustrated performance that isn’t far off of its smaller competitors that are dependent on returns from non-participating business lines. To be clear, Northwestern Mutual is still far off of Penn Mutual in terms of the illustrated rate, but the gap is starting to close.
With both Northwestern Mutual and Penn Mutual making such substantial moves in their DIR, it’s hard to imagine that other carriers will wait on the sidelines. The competitive landscape is going to look dramatically different by the end of this year. If you look back over the history of Dividend Interest Rates, there are always cycles. There was a time where each one of the Big 4 held the mantle for highest DIR and strongest illustrated performance. Those are heady days, but they seem to always come to an end. It would be a mistake for anyone, under any circumstance, to confuse today’s DIR and illustrated performance for even the vaguest shadow of actual future performance, for better or worse.
This brings us back to Penn Mutual. Let’s just assume, for a second, that Penn Mutual’s NII of 6.9% attributable to its Whole Life block that is fueled by certain investments and investment strategies is the primary reason why their products illustrate so well. If that’s true, then it raises a much bigger question – for how long? Is it reasonable to think that Penn Mutual is going to hold the edge over its peers for the next 50 years even as it grows? Are the investing opportunities that make a big difference when Penn Mutual has a $250 million dividend still available and impactful with a $2.5 billion dividend? Does it makes sense that investment returns will trump expense management and quality mortality*** over time? Should we assume that Penn Mutual’s heavy allocation to exotic assets is a better play than building non-participating businesses that kick of earnings?
These are all questions without answers, but they’re questions worth asking. Penn Mutual offers incredibly well designed and compelling products. There is no doubt about that. They are worth selling or buying simply on the merits of the products themselves. The fact that those same products illustrate better performance than their peers, however, is not a reason to sell them.
Before Penn Mutual, who had the best illustrating Whole Life products in the market? Ohio National. And to be clear, Penn Mutual is no Ohio National – not by a long shot – but the lesson is still valid. Illustrated performance should not be a part of the consideration process for Whole Life. Instead, the focus should be on the company. When you buy a Whole Life policy, you buy the company, not the illustration. In the long run, the fundamentals win out and the noise of short-term actions gets lost in the static. If you’re choosing between whole life products sold by a high-quality company focused on delivering efficient returns for its sole owners, the policyholders, then you can’t go wrong.
*I was asked one time by a layperson how I would compare Dividend Interest Rates across carriers and my response was to quote the famous scene from This is Spinal Tap where the lead singer explains to the director that his favorite amplifier is the one that “goes to 11” and all of the other amps only go to 10. The same goes for DIRs. Carriers are consistent in how they apply the DIR, but the DIRs themselves are not comparable in the same way that an 11 on one amplifier isn’t comparable to a 10 on another amplifier, a subtle point missed by the gentle souls of Spinal Tap and insurance layfolk alike.
**Short of reverse engineering their Whole Life product, the other bit of evidence that NM looks at their DIR this way is that they actually offer it as a credited rate on their Universal Life policy, which obviously comes through completely pure.
***Penn Mutual’s ACE program is an absolute marvel of process engineering and, in no way, do I want to insinuate that it is anything but awesome for producers and their clients. However, the fact that Penn Mutual stands alone in offering this type of program means that it is, from a mortality risk standpoint, either brilliant or reckless. They may have figured out something that no one else has – or they are taking on mountains of mortality risk that has yet to bite. It is also indicative that the other major mutuals have waded slowly into accelerated underwriting because they are so adamant about protecting mortality results. It’s an indication, I think, of what looks like a move-fast-and-break-things philosophy playing out at Penn Mutual versus its staid peers. There are real advantages to being nimble – and real potential costs. Only time will tell.