
Nothing Is Certain in Life Insurance Except Death and Charges

— A C H A R G E S P R I M E R : P A R T I —
(14 min read)
—By Kasey Gammons—Let’s pretend we are designing a protection case that asks for the best “price” to carry the policy to maturity—with the death benefit guaranteed through at least life expectancy as a backstop. After going through the process, there are two contending products to choose from:
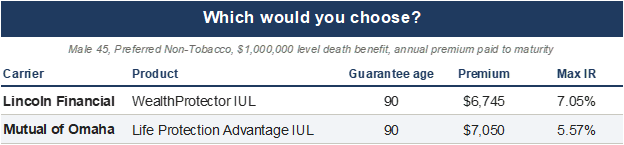
If premium were the only consideration, the clear choice would be Lincoln with a cost savings of about $300 per year. Case closed, right? Except that a simple premium comparison is no indication of long-term policy viability. In Indexed Universal Life (IUL), performance could be impacted by lower index returns, reduced cap rates or changes to some other non-guaranteed lever the carrier can pull at its discretion.
The graph below shows a less rosy view by proportionally lowering the maximum illustrated rate—assuming the same premiums as above:
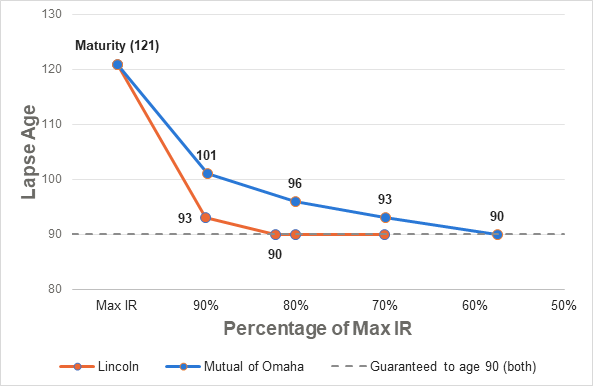
The lapse age in this scenario is how long the interest rate assumption will carry the policy on the nonguaranteed side of the ledger. Immediately apparent is how much faster Lincoln drops off as the IR is lowered—down to its baseline age 90 guarantee at 82% of its max IR (versus Mutual of Omaha at 57%). It’s reasonable to chalk the difference in sensitivity up to the fact that Lincoln has a lower premium than Mutual of Omaha, but even if you fund Lincoln using Mutual of Omaha’s premium $7,050 premium, the story doesn’t fundamentally change:
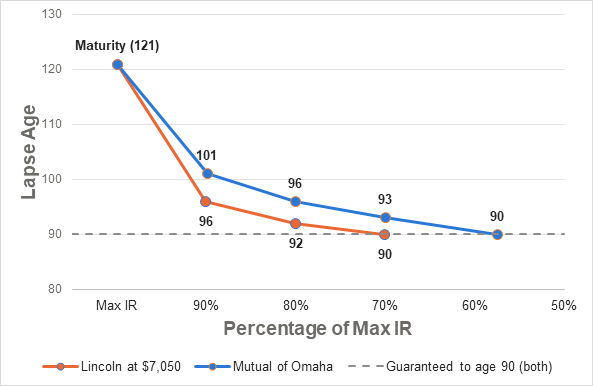
To put this in a different light, at the same $7,050 premium and assuming a 5% average return on both, Lincoln’s values give out right at its age-90 guarantee while Omaha’s carry it to 101. Each policy’s value is a running tally of two things: money going into the policy in the form of premiums and interest credits, and money coming out in the form of policy charges and withdrawals. In the scenario, the two products have the same cash inflows in terms of premium and interest credits, but the performance is different. The explanation, therefore, must be the policy charge structure.
Policy charges and interest credits don’t behave the same way. Charges come out every month, every year, in every market. If the only certainties in life are death and taxes, in life insurance it’s death and charges. Credits, however, can fluctuate considerably because they are dependent upon volatile external factors such as market (or index) performance or the returns on their general account portfolio.
That asymmetry between the behavior of charges and credits is why these two products trade places under stress. Lincoln is built with heavier charges and a richer crediting engine to pay for them, such as a higher illustrated rate and policy value bonus from year 21. When the credits arrive as assumed, that engine covers the charges with room to spare and Lincoln wins on premium.1 When they don’t, the charges keep coming and the engine can’t keep up with the heavier drag. As you can see in the chart below, Mutual of Omaha has a lower long-term charge structure, which is why a 5% rate carries it eleven years further.
Here’s what this looks like visually on the charge side:
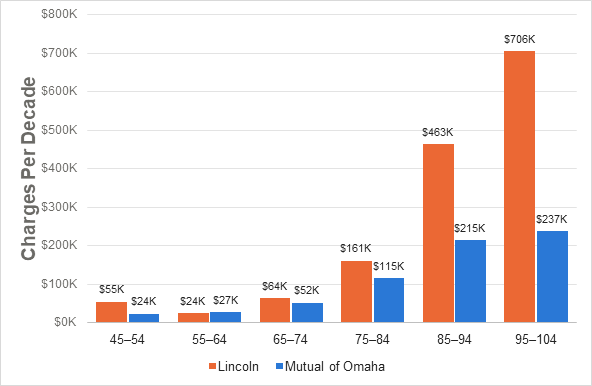
Although charges are the part of the policy you can count on, most of the time they are invisible. An illustration only prints the net result: premiums in, charges out, plus any net crediting assumptions. Illustrations tell us nothing about how much was credited or taken out to get there. Ironically, illustrations were meant to demonstrate the mechanics of how a life insurance policy works – but without the charge report, that’s virtually impossible to figure out. Two products can print similar values, but that doesn’t mean they’re going to behave similarly in the real world.
To look under the hood at what is powering the vehicle, we must turn to the charge report for current-basis charges—which is what we consider in this primer. Guaranteed maximums must come from either the filing or specimen contract itself. However, a small minority of carriers don’t print the report at all through third-party distribution software like WinFlex.
—Charges and What They Are Levied On—
Other than straight flat fees, policy charges are levied on four different bases: premium, face, net amount at risk and account value, where:
Amount Charged = Rate times Base
This is essentially the formula for how much is charged in any given year, but when a charge happens and how long it continues will be a huge piece of the puzzle in determining actual impact on real performance.
Premium Loads
Every time premium is paid, a percentage, or “load”, is assessed to cover contract acquisition costs and state taxes. 2 It is the cleanest example of rate times base: on a $10,000 premium with a 5% load, $500 comes out before anything reaches the account. Loads range from low single digits to low double digits, and they commonly vary by policy year. When they do, they are higher on the front end, which helps the carrier recoup acquisition costs faster and hedge against early lapse and profitability risks.The table below shows how premium loads are priced by policy year at four different carriers:
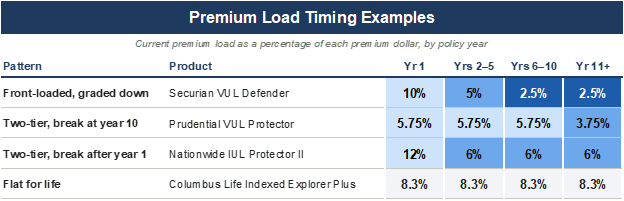
Some products, especially protection-focused ones, also impose a higher load on premium above target. The Mutual of Omaha product we used above charges 4% up to target and 7.5% on anything over it. That discourages consistent overfunding and creates more drag than in a minimally-funded design. Accumulation products almost never do this, because overfunding is the entire point.
With higher early charges, tiered structures or an excess load, shorter-pay designs can feel the pain substantially more than a full-pay one.
Per $1000 Charge
Every incremental $1,000 of the initial face amount is assessed a “per $1000” charge, which tends to be static and front-loaded for the first 10-15 years. This helps the carrier recover the bulk of the agent’s commission and upstream distribution costs. Nationwide’s IUL Accumulator III separates out this charge, calling it the “Per $1,000 of Specified Amount Charge.” It works out to $3,607 a year for ten years on an initial face of $1,000,000—or about $3.61 (0.36%) per $1000. Most carriers group their per $1000s with other charges, making them hard to quantify.
The charge is based entirely on the initial face amount. If the death benefit grows through an increasing (option 2) or return-of-premium (option 3) death benefit, the charge stays where it was. A scheduled face increase does raise it, because the added units start their own per 1,000 schedule. A few companies step the charge down partway through; Penn, for example, cuts its rate in half after year five. The most common structure is a level charge for a set period, most often ten years, before it drops off completely.
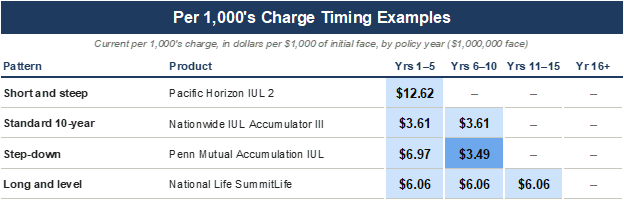
Every product carries this charge in some form, but the size and length can vary substantially. In the table above, Pacific Life collects about $63,000 over five years and Nationwide about $36,000 over ten, on the same $1M face.
Cost of Insurance
All charges discussed before this point are designed to recoup costs involved in getting the policy on the books. However, the cost of insurance (COI) pays for the death benefit itself and is in every life insurance contract. The charge covers the chance of the insured dying in any given year and increases as the insured gets older because it is based on the risk of death. COI rates are not exactly mortality tables, though. The mortality table is the starting point; what actually prints is the carrier’s current COI scale, which layers on its own actual mortality experience and reinsurance cost, expense and profit margin, and often a slice of acquisition costs it chose not to recover in the premium loads or the per $1,000 charges. Two carriers facing the same risk of death can print very different COI curves, which is a pricing decision as much as an actuarial one. The graph below shows just how different these interpretations of mortality can be:
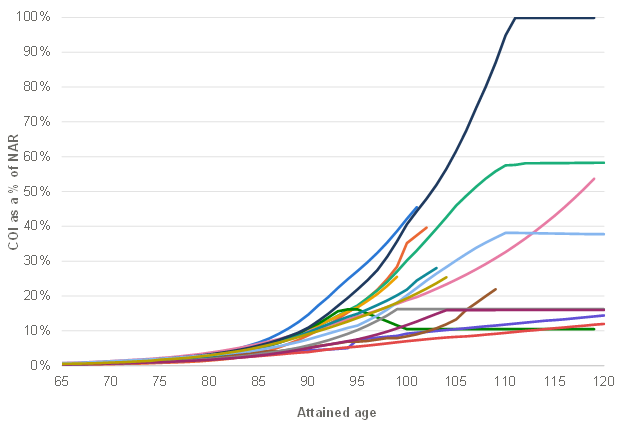
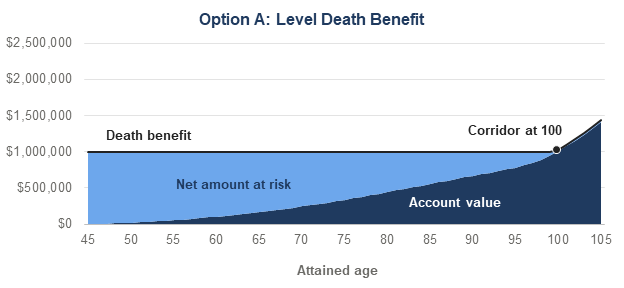
COIs are based on the net amount at risk (NAR), which is defined as death benefit (DB) minus the account value (AV). This is the amount that a carrier is on the hook for when the insured dies. On a $1,000,000 level DB with $110,000 of account value, the COI rate is levied on the $890,000 NAR—not the full million.
Term insurance charges are essentially just COI plus an admin fee. The NAR is always the full amount of insurance, since there is no cash value inside the contract. However, the total COI charge may decrease over time in a permanent policy (even though the rate itself increases every year) if the policy builds enough cash value to shrink the carrier’s NAR. In accumulation designs with a level DB, excess premiums drive up the AV and reduce NAR. Eventually, section 7702 of the tax code may require the carrier to increase DB in order to remain a minimum percentage above the cash value (this is called the “corridor”). So even though the COI rate is climbing with age, it may be more than offset by a shrinking NAR. This is one of the primary ways that overfunding a policy can help de-risk it, rather than relying on high interest rate assumptions or expensive long-duration guarantees.
An increasing DB (option 2) makes the total DB each year equal to the initial face amount plus the policy’s account value. This holds NAR steady over the life of the contract, making it the most expensive way to carry a policy into old age when COI rates are increasing rapidly on the full face amount. However, using option 2 is the best way to compare different products’ COI curves because it holds NAR completely steady over the lifetime of each illustration. Increasing DB designs almost always switch to level at some point in order to reduce NAR and thereby offset higher COI rates late in life.
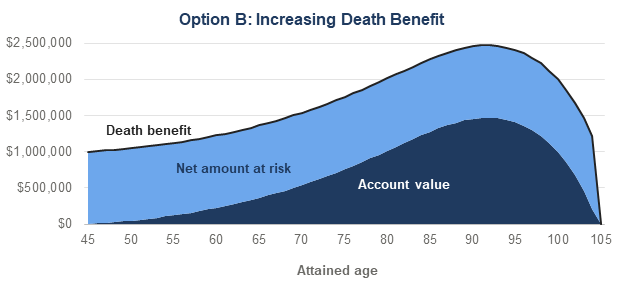
In this chart, account value peaks at age 92. After that, the COI drag begins to overpower the assumed crediting rate in the illustration. As account value decreases, the death benefit also decreases to maintain the same $1M in NAR.
The graph below compares COI rates for Lincoln AssetEdge VUL and Penn Mutual Accumulation VUL, both on an increasing DB:
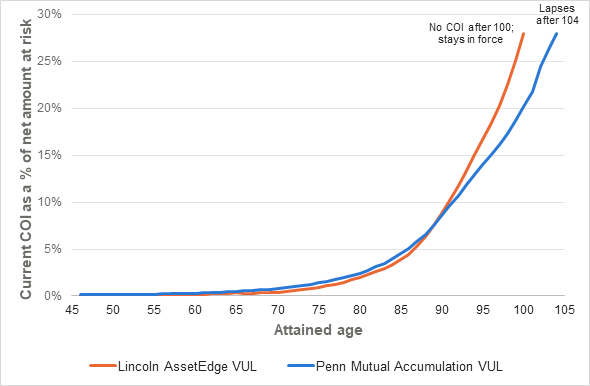
Lincoln charges less through age 89. Penn is cheaper from 90 on, but Lincoln stops charging COI entirely at 100, and the policy stays in force. Penn keeps charging on the full $1,000,000 face, and four years of COIs between $218,000 and $280,000 drain the account until it lapses after age 104.
COI tends to have the biggest negative impact on minimally-funded policies with level DB. Policy AV may grow a bit during the early years, but the design depletes the cash value at maturity. The minimal funding causes COI to remain high, since the cash value growth is typically not substantial enough to significantly reduce NAR. In this case, the crediting over the life of the policy will have to be much stronger to overcome the higher COI rates and NAR in later years. Lower late-age COI is a large part of why Mutual of Omaha held up better than Lincoln in our original example when rates dropped. At age 89, Lincoln was charging nearly double what Mutual of Omaha was.
Account Value Charges
Account value-based charges are the least common and mostly appear in variable products in two forms: the mortality and expense (M&E) charge the carrier deducts, and the fund expenses inside the investment sub-accounts. Both are assessed as a percentage of AV, which makes them different from every charge above. The more the policy accumulates, the more AV charges are collected—on a compounding basis—while the policy is in force.
We looked at fifteen VULs in a recent review, and six have an M&E charge on a current basis: five between 0.10% and 0.30% of AV per year, and one at 0.90% for the first ten years and nothing afterward. The rest don’t currently have M&E expenses, although their prospectuses state a guaranteed charge that could come into play down the line. In most cases, the expenses on the investment sub-accounts are bigger than M&E, with a weighted-average charge on the carrier’s default funds of about 0.15% to 0.60% a year. Fund expenses also won’t appear on the charge ledger at all; they come out of the funds’ returns before anything is credited. Together, the fund expenses and M&E charges usually cost a VUL somewhere between 0.15% and 0.80% of AV annually. Over a thirty-year accumulation period, that can be a sizable drawdown on cash value growth, not a rounding error.
General account products rarely print an M&E charge, but the cost didn’t disappear. Every carrier has mortality and expense risk to cover; in these products those costs are spread out among other charges—or see some sort of tradeoff inside crediting mechanics.
AV charges also show up in IUL accounts with a higher capped index strategy or a multiplier. They are tied to those particular accounts rather than the whole product, so the client pays the charge only on money allocated there. The bet the client is making is that the increased upside potential will outweigh the annual charge. But as we said earlier, while charges are a sure thing, the credit depends on index performance.
Admin Fees
Administrative fees are typically small monthly charges that do not change, regardless of death benefit, premium amount, or account value—ranging from around $60–$240 a year. They cover the cost of keeping the policy on the books via statements, policy changes, billing, service requests, and associated paperwork. Because the fee is a fixed dollar amount, its impact depends entirely on the size of the policy. On a $1,000,000 case it’s less than pennies on the dollar, but $120 a year on a very small-face policy has a much bigger impact. Outside of final expense, the admin fee has a very minimal impact compared to the others we’ve discussed.
T O B E C O N T I N U E D …
This primer covers the types of policy charges and their impact on the life insurance contract. We’ve now seen and covered the gamut: premium loads on every dollar that comes in, per $1,000 charges on the initial face, cost of insurance on the net amount at risk, AV charges, and a flat admin fee on top. Taken one at a time, none of them is complicated. What decides how a product behaves under stress, as Lincoln and Mutual of Omaha showed at the start of this piece, is how the carrier weights charges against each other. In Part Two, we will put everything together and discuss how to understand when, where, and how these charges have their impact inside the life insurance contract.
Stay tuned!
1 The scenarios above assume a minimum-funded design. If you fund Lincoln at the higher $7,050 premium and assume a Max IR, the policy begins hitting corridor in the mid-90s. At that point, NAR shrinks and reduces COI to near zero. Paying more than the minimum premium is another way to help mitigate the risk of late-stage COIs lapsing the policy, at a cost.
2 States will charge the insurer a premium tax—typically between 1%-3% of the premium—which is then paid on your behalf out of the premium. “Acquisition costs” is a blanket term that covers commissions (the largest piece), as well as the costs associated with underwriting, new business processing, and marketing.