

#423 | Premium Financing at the Precipice

In an article from two years ago, I wrote that “from my vantage point, the worst is almost certainly yet to come for premium financing. The longer the current conditions persist, the more problematic these transactions are going to become. One year is bad. Two years is far worse. Three years is unimaginable. Clients who have had collateral calls are going to get bigger ones. Clients who haven’t had collateral calls are going to get them.” Well, here we are at three years of higher rates with no end in sight and that is exactly what has happened.
It feels like I see a new lawsuit (or terrible situation that is about to become a lawsuit) crossing my desk every couple of weeks and the pace is starting to meaningfully pick up. Each one is slightly different in form and claims, but the theme is the same – Indexed UL and premium financing. We are now hearing the audible pop in the premium financing market that has seemed inevitable from the moment that rates started to rise.
The triggering event for most of these new premium financing lawsuits is fundamental and unavoidable in every premium financing deal – collateral. It’s the crucible of the transaction. The agent sells long-term return arbitrage, but the client experiences collateral calls. Constant return and loan rates form the basis of the original proposal, but variable return and loan rates are the only real-world experience.
Consider a case I saw a few weeks ago where the average crediting rate exceeded the average bank loan interest rate by almost 200bps since 2017. What’s the problem? The problem is that the average is not relevant for collateral. What matters is the sequence. An 8% loan interest rate is not a big deal in terms of collateral because the outstanding loan balance is low, but it’s a real problem in year 10. As a result, this client was subjected to a multi-million dollar collateral call despite having solid performance in the policy simply because of an adverse sequence of events.
For a more generalized version of the problem, take a look at the chart below showing projected collateral for a premium financing arrangement. Both have average realized spreads of 200bps between the illustrated rate and the loan rate. The illustrated scenario has a constant 4% loan rate and the “actual” scenario has a 2% loan rate that pops to 8% for 4 years and then drops back to 4%. The assumption is that all interest is capitalized.
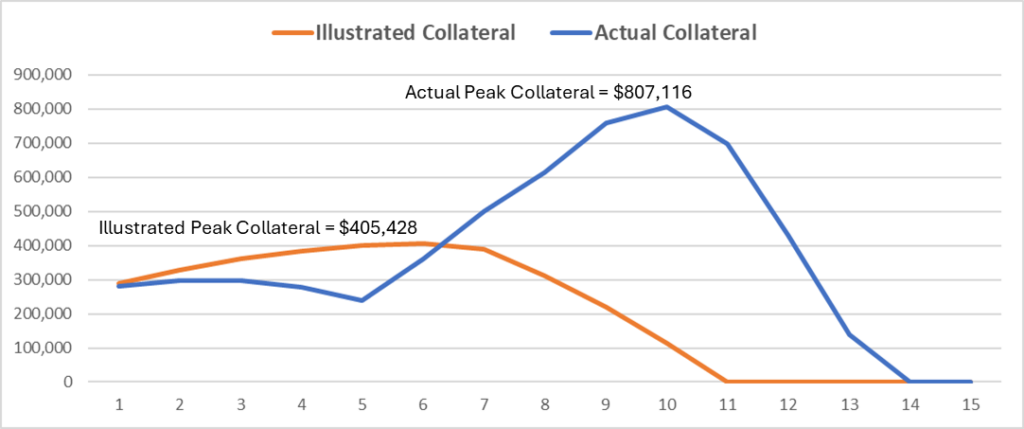
If this scenario seems extreme, then consider the fact that premium financing vendors were illustrating capitalized interest deals with 200bps spreads (at least) prior to 2022. A policy sold in 2017 got 5 years of low loan rates (with the exception of part of 2019) and is currently three years into a much higher rate cycle. The scenario above isn’t far-fetched. It’s what virtually every in-force premium financing client is experiencing right now. Little wonder that clients are furious. This wasn’t supposed to happen. Right?
No, this was exactly what was supposed to happen. The original collateral projection wasn’t real. Reality, of course, is variable. Equity returns are highly variable in the short term but fairly consistent in the long-term. Interest rates, however, are not particularly variable in the short run but are highly variable in the long-run. From 1920 until the mid-1940s, interest rates consistently declined. From the mid-1940s until the mid-1980s, interest rates consistently increased. From the mid-1980s until 2022, interest rates consistently declined. What comes next for interest rates is probably not year-by-year volatility but, more likely, a new regime of either increasing or decreasing interest rates.
To get a feel for how changing interest rate regimes interact with potential collateral strain, I started with the same setup of a 6% illustrated rate with a 4% loan interest rate. But this time, I allowed the loan interest rate to float in either a rising interest rate or falling interest rate regime over the next 15 years in an attempt to mimic what we’ve actually seen in the real world. The results were pretty interesting, as you might expect. Each dot in the graph below shows the collateral requirement for one of the 50 scenarios. The solid line is what was illustrated for collateral, the dotted line is the average of the 50 scenarios. The assumed index crediting rate is a constant 6%.
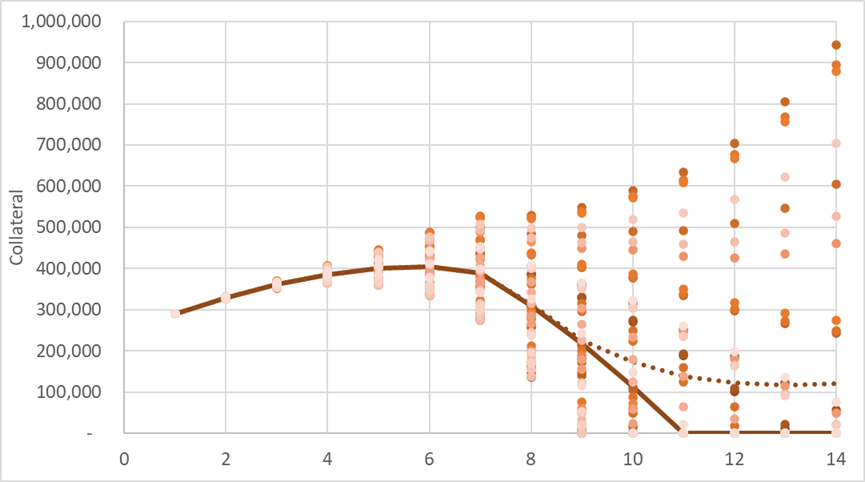
Even though the average for all of the scenarios is still 4% for the loan interest rate, the fact that the returns are variable and that collateral is only ever positive means that the average expected collateral isn’t 0 – it’s $100,000 even by year 14. Some scenarios have collateral well in excess of the peak projected collateral in the original illustration.
Collateral is obviously also dependent on what happens with indexed crediting. The chart below shows a constant 4% loan interest rate but variable returns based on a 10% Cap, which produces an average AG 49 maximum illustrated rate slightly in excess of 6%. For simplicity’s sake, we’re giving a bit of an edge to the variable return illustration, which is partly why the collateral requirement for the average variable return is actually slightly below the illustrated amount early in the life of the arrangement. The chart is set up the same way.
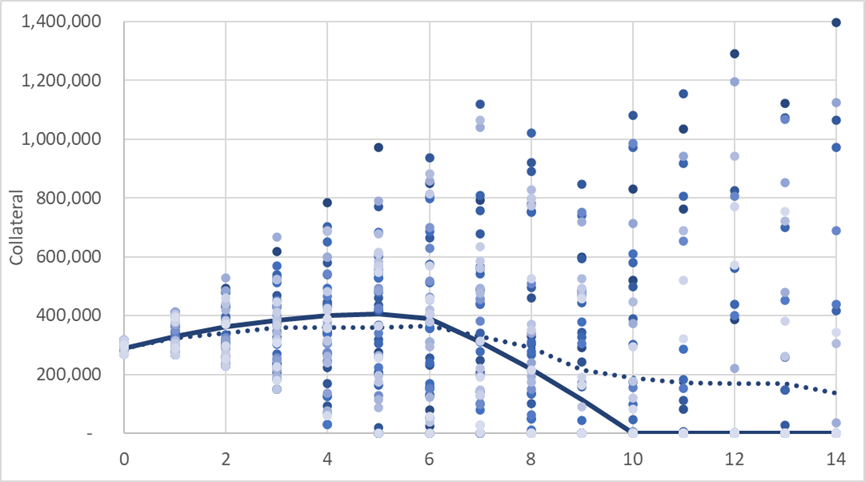
As you’d expect, the variability of returns is substantially higher than on the loan interest side and the ultimate result is more average collateral as well. There are some scenarios with substantially higher collateral than in the previous graph, which meant a higher scale to $1.4 million rather than $1 million. And you know what’s coming next – the combined effect of both index return and loan interest variability, which is what the chart below shows. The combined effect isn’t as clean as adding 1-to-1, but the average required collateral in later durations is nearly $300k by year 14 and the worst-case scenarios are substantially worse.

The typical rebuttal to this logic is that Caps will follow interest rates, which offsets the effect of a rising interest rate environment. It would be nice if things were that simple but, as I’ve written in other posts, that’s not how it works. Option prices also increase as interest rates rise and, as I wrote recently, carriers have enormous holdings in 10+ year and 20+ year maturity bonds. It will take a decade to wash all of that out and for portfolio yields to come back to new money yields. Hence, the reason why we’ve seen Caps move upwards only sporadically and at a glacial pace for in-force blocks despite 3 years of higher rates.
But let’s just pretend that Caps move with interest rates. Below shows the same chart as above with both rate and index return variability, but it also assumes that a 0.1% movement upward/downward in interest rates results in a 0.2% movement upward/downward in the Cap, a kludgy assumption but directionally accurate. The effect is what you’d expect – the worst-case scenarios are muted. But they’re still way worse than the original illustration and so is the average collateral strain. Rising Caps does not solve the problem even if it mitigates the damage.
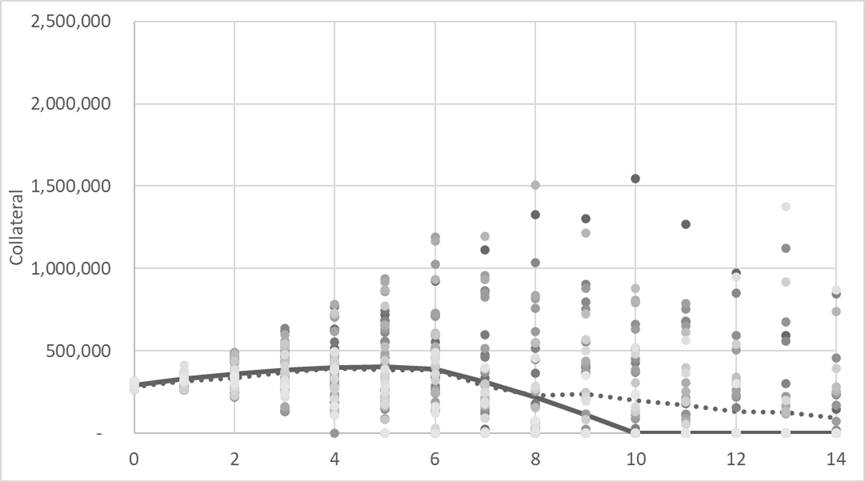
How do we interpret what these charts show? The wrong way, I think, is to say that these charts show what will happen to premium financing collateral requirements. Instead, these simply show what can happen over particular scenarios. But it’s even more nuanced than that. A policyholder that entered a premium financing arrangement in 2014 is now, 10 years later, experiencing much higher interest rates with large loan balances and the potential for enormous collateral calls. A policyholder that got into one of these deals in 2021 has the same loan interest problem but at a much smaller scale. All clients will get the same scenario – but at different times.
That dynamic is playing out in these lawsuits and pre-lawsuits. I am routinely seeing mature cases where the collateral calls are hundreds of thousands if not millions of dollars for mature arrangements. That is never supposed to happen. The original projections for virtually all of these deals show collateral release, not collateral expansion. These policyholders had years of low loan rates and high index returns at exactly the wrong time. Now, they’re getting sacked with 7% loan interest rates and, in some cases, poor index performance. They are understandably furious.
Newer policyholders have a different dynamic to contend with. In pure dollar terms, the collateral strain is lower so it should be less of an issue, but it’s not. Why is that? Because, as I’m seeing increasingly in these cases, the policyholders do not have the ability to cover the collateral. This should also never happen. Premium financing is supposed to be for people with a net worth of more than $10 million and have the capacity to pay the premiums out of pocket. If both of those conditions are met, then posting gap collateral in any given year should be a non-issue.
Often, those conditions aren’t met. I can’t tell you how many times I’ve seen cases cross my desk for clients who simply don’t qualify for the policies and certainly not the premium financing. They are collateralizing their home equity, cars and personal belongings to meet the requirements. It is insane. That should never happen and yet it does. How? The stories are almost impossible to believe. Fabricated tax returns. Inflated business valuations. Forged signatures. False bank statements. Things, again, that should never happen.
How do these sorts of things get past the insurers? Well, that’s where the story gets weird. I seem to see the same four or five life insurers on these sorts of cases come across every time. It’s impossible for me to see so many cases with similar fact patterns and to not think that there is a systemic issue at these life insurers. They either know what they’re doing and are turning a blind eye or they have no idea and are about to find out with waves of rescissions and litigation. It is hard to imagine that there won’t be real consequences for the carriers who have let these cases through, both in terms of litigation, recissions and potentially issues with their reinsurers.
There will always be a place for premium financing as a planning tool. Clients with proper expectations, commitment and capacity aren’t throwing in the towel on their financing arrangements. The problem is that it seems that far too many cases seem to not meet those basic criteria. Expectations were inflated. Commitment was limited. Capacity is low. For years, Indexed UL performed well enough with low borrowing costs that the problems were hidden. But as soon as the trade started to unwind, the underlying issues started to show up.
It’s hard to imagine that things don’t get worse. The typical panacea for premium financing is simply to assume that interest rates drop going forward. In fact, as I’ve written before, virtually all premium financing proposals that I see these days (which is a lot less than I used to see) assume falling interest rates in the future. A return, in other words, to the good ‘ol days of high policy performance and low borrowing costs.
For in-force policies in an old portfolio, that would certainly help the situation. There are some cases now where the borrowing cost is close to the S&P 500 Cap. There is no way for those premium financing arrangements to “work” as originally sold. Falling rates would widen the gap.
But since 2022, premium financing has shifted to policies and carriers that are using new portfolios to support their current Caps. In a falling rate environment, those products using new portfolios will have to drop Caps dramatically because they have very few older, higher yielding assets to fall back on. Dilution will be swift and steep. Falling rates might actually hurt premium financing deals relative to expectations. Be careful what you wish for.
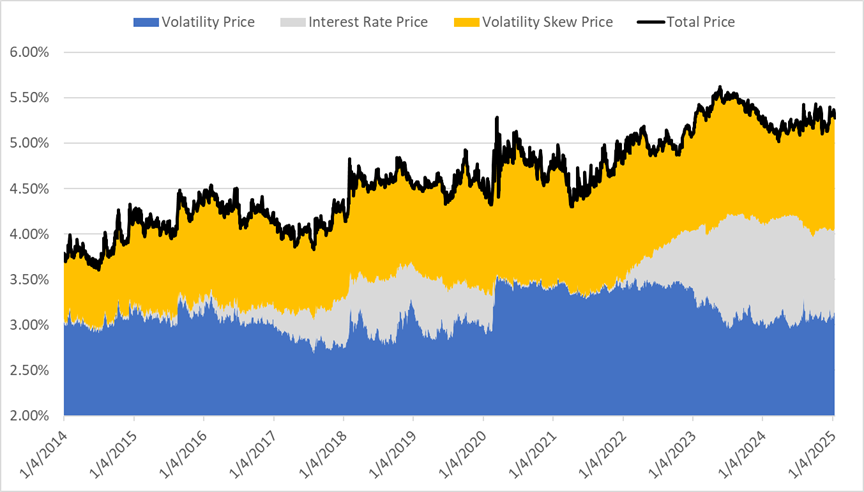
At the same time, index crediting returns are unlikely to pull off a repeat performance of the blockbuster returns over the past 15 years. Option prices remain extremely high. The chart below shows the price of a 10% S&P 500 Cap going back to 2014 with constituent parts. Volatility price is the contribution of pure-at-the-money volatility. Volatility skew price is the contribution of volatility skew, which is the difference between implied volatility at the Floor (100 strike) and Cap (110 strike). Interest rate price is the contribution from the interest rate component.
Indexed UL has essentially only existed during the greatest bull market in history – and that is almost entirely a domestic phenomenon. Consider what would have happened if Indexed UL had been a global phenomenon and invested in global equities. The chart below shows 1-year return strings that mimic Indexed UL crediting for the S&P 500 and the S&P Large Cap (Excluding US) Index over the past 10 years:
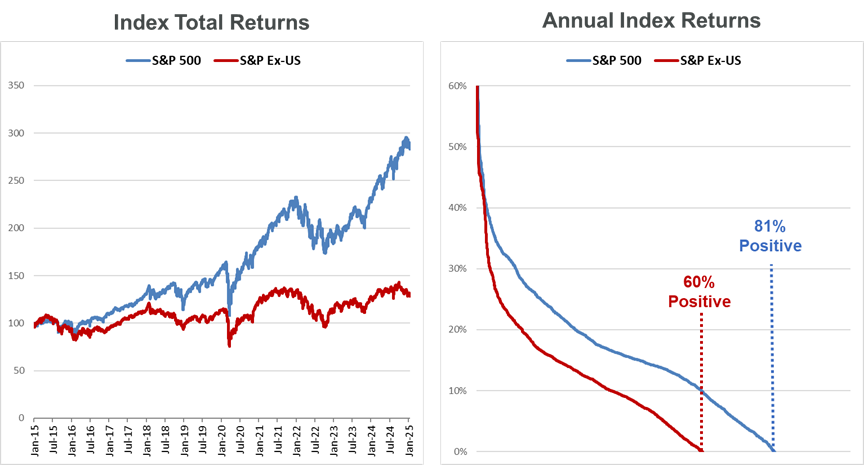
The difference is massive. The S&P Ex-US average annual return from each trading day is 4.26% while the S&P 500 delivered an average of 12.31% over the same period. The S&P 500 had 81% positive annual returns but the S&P Ex-US had just 60% positive. The reality is that Indexed UL’s success is a function of lights out performance in the S&P 500. If Indexed UL had been pegged to indices for basically anywhere else in the world, the performance of the product would have been much closer to the fixed account crediting rate.
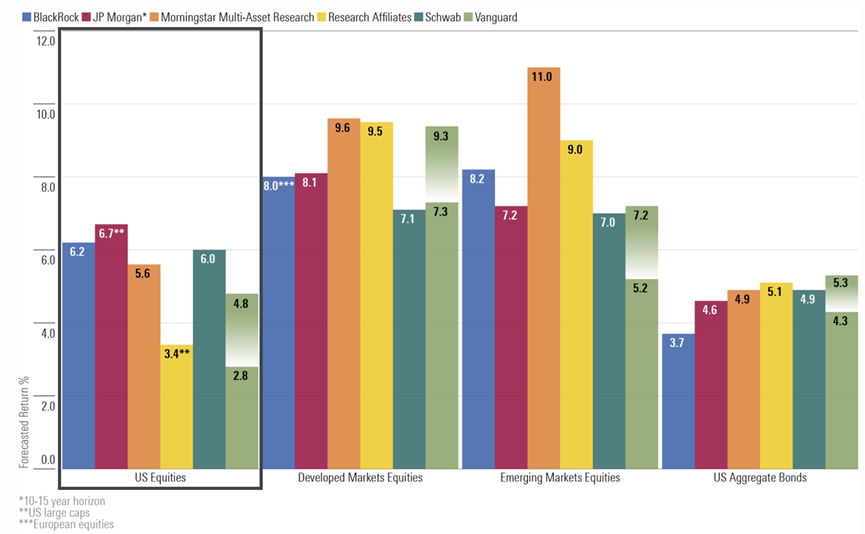
At the same time, consensus capital markets assumptions (which are compiled by Morningstar every year) point to total S&P 500 returns of around 6%, which is 10% less than average annual returns in the S&P 500 since 2009. That’s a stunning gap. The capital markets assumptions point to a normalization of US equity returns to world equity returns and, if that happens, Indexed UL crediting will drop to where it probably should have been all along.
The solution pitched so far by carriers has been to switch out of the S&P 500 and into engineered indices. I’ve written a lot on this topic so I’m not going to rehash the arguments, but the short version is that engineered indices have failed to live up to the expectations of performance set by their backtested returns. Instead, they have done exactly what they’re designed to do – low risk indices deliver low returns. Take a look at the performance of engineered indices with volatility targets between 5% and 6% in 2024:
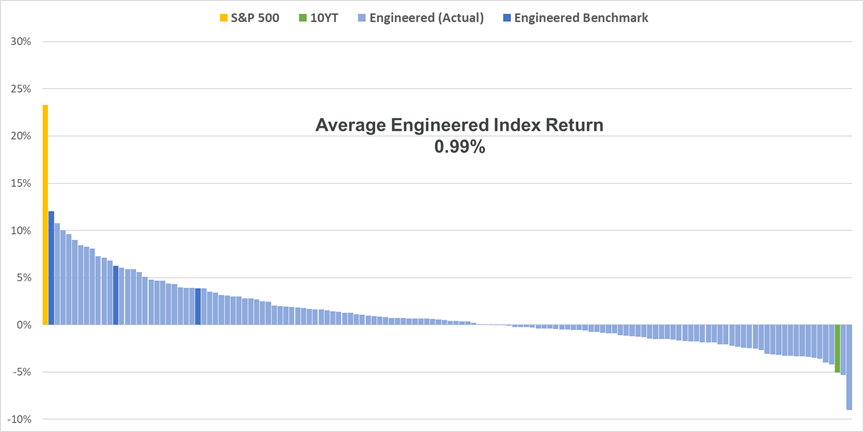
Yes, you read that correctly. The average index return was a paltry 0.99% with more than 40% of indices posting negative returns for a year when the S&P 500 hit almost 25%. What is going on? The answer is simple. These indices are designed to have small equity allocations and larger allocations to long-duration fixed income or cash. Virtually all of them are Excess Return, which means that they have to clear the risk free hurdle rate of around 5% for last year just to post a positive return. A lot of them just couldn’t do it and, as a result, posted negative performance.
Put all of this together and the prospects for premium financed Indexed UL sold on the basis of perpetual positive arbitrage are bleak. I think there’s also a chance that the environment becomes so challenged that some of the large-scale premium financing programs designed for middle-income folks could become imperiled.
All of those programs have the client put aside at least 25% of the premium to offset potential future adverse conditions. That’s a lot of equity – but is it enough for a prolonged environment of high interest rates and low policy performance? There is a very real chance that those policies exit their external financing but don’t have enough equity to provide meaningful retirement income.
If that happens, then there is the possibility for some of the biggest class action lawsuits the industry has ever seen. Some of these programs have sold tens of thousands of policies to companies, partnerships and non-profits nationwide. Participants could be in a situation where they have paid premium and have nothing to show for it – no retirement income and no return of their premium. They’ll have real losses and want real damages.
As an industry, we need to get ready for what may become a tidal wave of litigation – and not all of it is going to be a case of victim and perpetrator. As I’ve dug around in some of these cases and even spoken to some of the folks who have been involved, one of the consistent themes is that clients aren’t always innocent, either. It’s easy to torch agents, vendors and carriers for pitching irresponsible free insurance financing deals that will never work because of greed. But at the end of the day, some clients – not all clients, but some – knew that they were taking a risk but they also wanted to get something for nothing. They’re just as greedy as their agents. Only belatedly did they realize that they were the sucker at the table and that’s when they decide to litigate.
But for every client who was complicit on the deal, there are three clients who weren’t. I have heard so many heartbreaking stories of clients who have been financially ruined by failed premium financing transactions that should never have happened in the first place. Many of these policies should never have been sold and yet they were issued by reputable, highly-rated and experienced life insurers. These sorts of situations put the entire industry at risk – including the agents, carriers, distributors and even premium financing vendors who had nothing to do with them. We have the obligation of policing ourselves. And if we can’t, then we unwittingly delegate that responsibility to regulators and lawyers.