
If you were to look at the industry press releases about 2021 sales, you’d probably pick up one big storyline – both Whole Life and Indexed UL had gangbuster years, each notching 20% growth. Indexed UL saw $600M in increased sales in 2021 to $3.5B, but the growth was uneven, with some relatively large firms posting meaningful sales declines, the #1 seller having a flat year and a few sellers increasing at clips of 40% or more. Based on the way it looks, the business went to firms that are doing lots of premium financing and/or heavily promoting products with proprietary indices. And the more aggressive the firm, the bigger the sales increase, with a few notable exceptions. The illustration war in Indexed UL is alive and well.
It’s a different story in Whole Life, where a rising tide raised all ships. Total growth was nearly $800M to a grand total of around $4.7B. Sales growth was near-universal and fairly evenly distributed across. Firms with sales growth greater than 1% represented 94% of total Whole Life sales. For Indexed UL, that same figure was 77%. Or, another datapoint, the #1 Whole Life seller increased sales by 20%, but the #1 Indexed UL seller posted a sales increase of less than 1%. If you wanted to generalize, you might say that increasing sales in Whole Life was generally a category phenomenon, but for Indexed UL it was generally a carrier-specific phenomenon, albeit with a solid growth trend underlying the category as well.
But growth in Whole Life and Indexed UL pales in comparison to the astounding growth in another product category – accumulation-oriented VUL. The figures are just staggering. On the whole, sales for accumulation VUL are up 130%, policy count is up 85% and premium per policy is up 25%. So not only are more people buying accumulation VUL, but they’re putting more money into new policies as well. And it’s not the result of a few products having a banner year. Like Whole Life, it’s a category-wide phenomenon. Every single company saw massive sales growth. Take a look at the data for the 19 companies in the accumulation VUL market showing premium growth, policy growth and premium per policy growth ranked by total accumulation VUL sales in 2021:
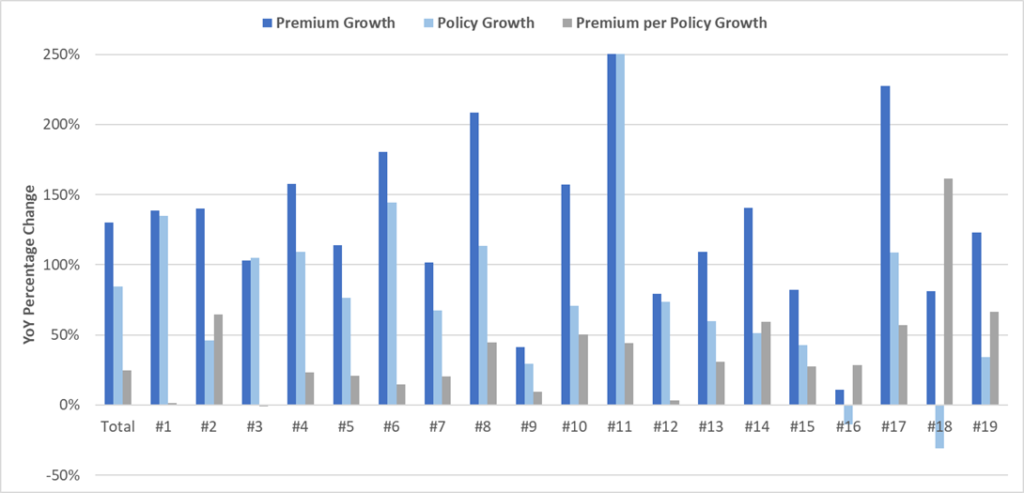
The insane thing about the increase in every metric for accumulation VUL is that the trends are completely uniform, even more so than in Whole Life. Every company but 2 saw significant increases in all 3 metrics. Companies that have recently refreshed their VUL portfolio saw the same growth trends as companies who have literally not touched their products in years. Companies that distribute exclusively through captive career forces saw the same growth trends as companies who distribute primarily through insurance brokers and institutions. Companies that were already dominant in the space – PacLife, Northwestern, Riversource, Equitable, Lincoln – saw the same sort of percentage increases as firms with smaller sales bases, such as Penn Mutual or Securian. None of it mattered. The entire market segment got absolutely drenched in growth in 2021.
That fact begs the question – why? As I wrote about last year in #288 | Private Placement Goes Mainstream, the rising tide that is lifting all accumulation VUL ships is the fact that life insurance is an undeniably attractive way to control tax incidence on high performance investments. In PPLI, those high-performance assets tend to run towards exotics and alternatives. That’s what fundamentally makes PPLI more attractive to high-net worth clients than a retail VUL product, where the investment options are more vanilla. Regardless of the investment strategy, the pitch is the same – buy term and invest the difference in an account that allows you to defer tax incidence and potentially avoid it altogether. For policy expense drag of 100bps or less, what’s not to love?
The simple math usually shown to clients goes something like this – assuming an 8% return on assets with a 25% tax rate, the effective net after-tax yield is really 6%. But if we illustrate 8% in a Variable UL, we can generate (let’s say) a long-term internal rate of return on cash of 7%. The greater the return, the greater the benefit of the Variable UL policy because charges decrease as a percentage of the assets and, at the same time, the total taxes in the taxable account increase. That’s why VUL makes the most sense for high growth assets.
What are the charges in Variable UL? They generally fall into six buckets:
| Charge | Range | Type |
| Cost of Insurance | Table | Required |
| State Premium Tax | 1-3% | Required |
| Policy Fee | $60-240 | Required |
| Premium Load | 0-3% | Optional |
| Unit Load | Varies | Optional |
| Asset Fee | 0-0.5% | Optional |
I broke them down this way to show that some charges are required, some charges are optional. Accumulation VUL could not exist without the first 3 charges. There must be mortality coverage in order to have life insurance and that mortality coverage is paid for with Cost of Insurance (COI) charges. If you have a life insurance policy, the life insurer must pay a state premium tax on your behalf and it ranges from 1-3%, which is best matched with a premium charge of the same percentage. The company must provide you with policy statements, in-force illustrations and the ability to manage your policy, which means they have to charge you for the administrative costs.
The other 3 charges are optional in the sense that they do not have to exist in order for an accumulation VUL policy to exist. Generally, they cover three things – insurer overhead, insurer cost of capital and acquisition expenses, including commissions.
I bring all of this up to make the point that it’s somewhat sloppy to simply run a Variable UL illustration and show the net cash value IRR against the illustrated rate and chalk it all up to “drag.” Not all “drag” is created equally. Premium tax is an unavoidable drag. Commission drag is in lieu of paying the advisor asset-based fees on the taxable account and, as I’ve pointed out numerous times in other articles, the drag from commissions in a retail VUL policy is considerably less than the drag from a lifetime of asset-based management fees. Carrier overhead is generally in the ballpark of 25-35bps, pretty reasonable for the time, energy and effort that it takes to make a Variable UL policy.
That leaves the biggest, most obvious and most discussed “drag” line item – Cost of Insurance. There are fewer grains of sand in the beach and stars in the sky than there are the number of times that I’ve been told that the best design for accumulation life insurance is to minimize the death benefit in order to reduce “drag” from COI charges. And for a long time, I nodded along because in a strict sense, that’s true. If you want to maximize the illustrated return on cash values, then you should drop the death benefit as low as it possibly can go. But in a broader sense, is that really the best call?
What separates COI charges from every other “drag” line item is that there is a clear, tangible and quantifiable financial benefit provided by the charge – the death benefit. The typical line that quickly follows is something like: “my client doesn’t care about death benefit.” Maybe so. But in the same way as truth is independent of our belief in it, the death benefit is paid whether they care about it or not, even in heavily loaned policies. It must, therefore, be factored into the analysis.
To do that, let’s start with the classic comparison of a policy funded at the maximum non-MEC premium for 7 years with a CVAT Option 1/Level death benefit versus a GPT Option 2/Increasing death benefit switching to Option 1/Level in year 8 and reducing the face to GPT corridor. In the short run, we would expect the CVAT policy to generate less drag than the GPT policy because it starts with a lower initial death benefit, which means lower commissions, lower policy expenses and lower COI charges but, over time, the GPT will catch up thanks to its lower cash value corridor. And that’s exactly what we see – and, remember, we’re talking about drag here, so lower is better:
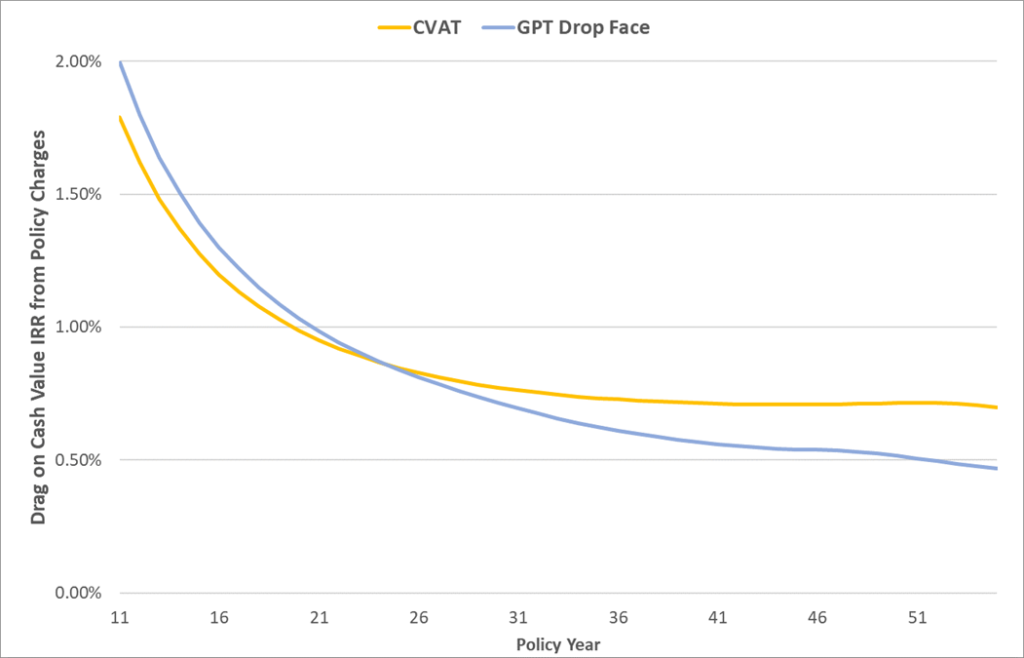
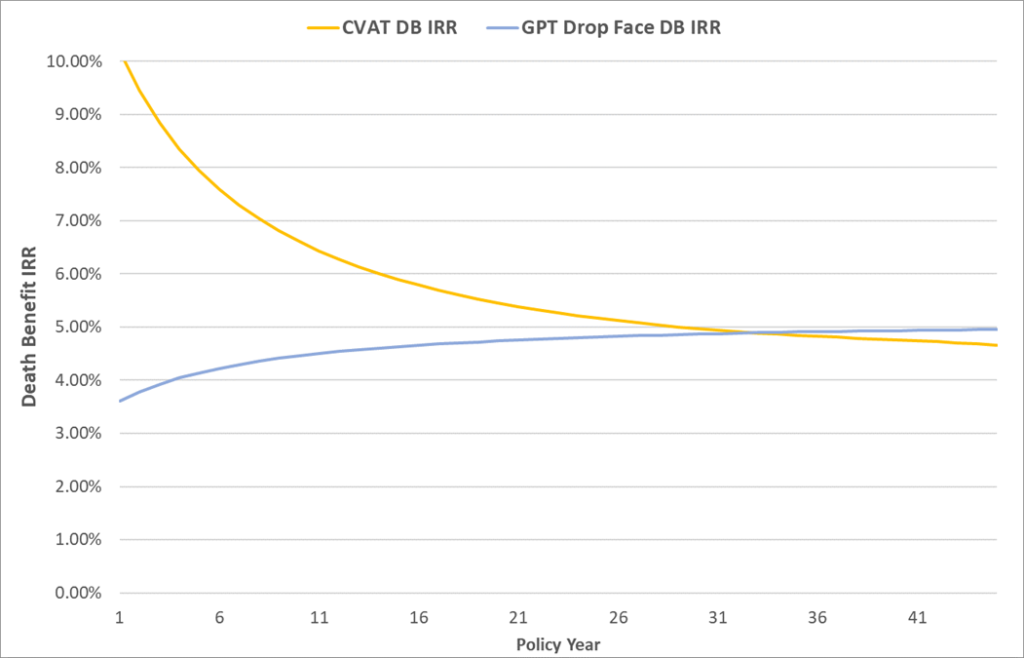
By age 90 on this 45 year old Preferred male, the CVAT policy has 71bps of drag, meaningfully higher than the GPT policy’s meager 57bps of drag. But is this really a fair fight? Consider the fact that the CVAT policy is carrying more death benefit along the way. If the client were to die during that time, then how do you account for the enhanced benefit provided by the CVAT policy? One way is to look at the DB IRR:
But how do we value this extra death benefit? One way is to run it against a mortality table to get some sort of actuarial IRR, but that gets pretty messy. So let me propose a very simple approach – let’s just assume that the COI charges are net neutral. In other words, that clients, on average, gets what they pay for with COI charges. Therefore, the effective total benefit of the policy is cash value plus accumulated COI charges. Here’s what happens if you take a generic VUL illustration, strip out the COI charges and add them back to the cash value and then run new total benefit IRR figures for the two designs:
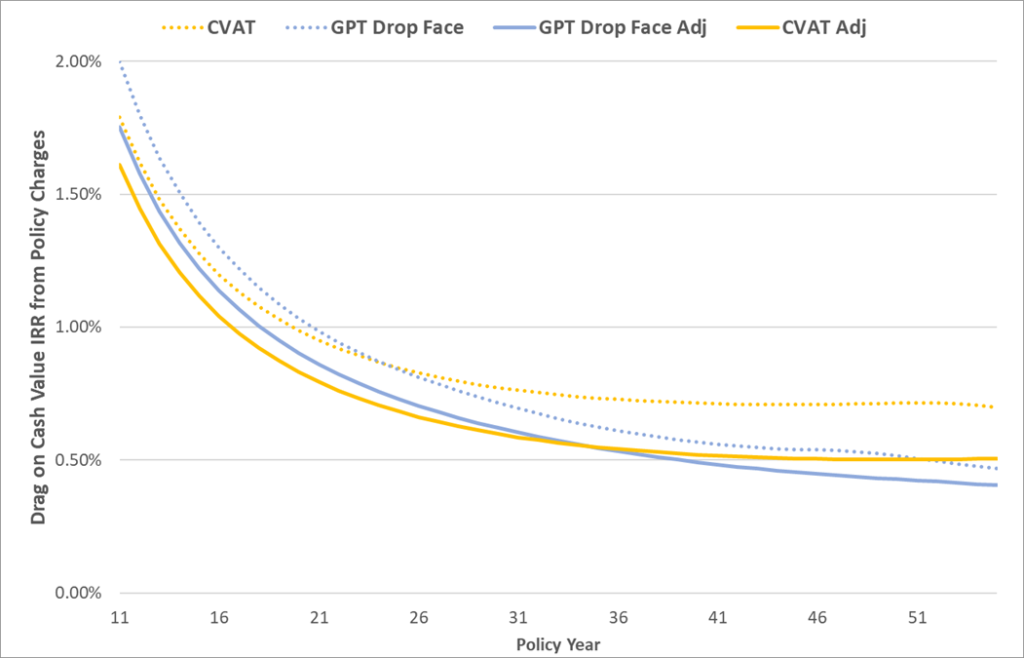
Using this approach, two things start to happen. First, overall drag drops meaningfully. For CVAT, drag drops from 0.71% to 0.51%, nearly a 30% decrease. Second, the difference between the drag in CVAT and GPT gets much tighter. Previously, they were separated by 17bps. Now, they’re separated by just 6bps. These results aren’t just a math game – they’re indicative of what the average client will receive. They’re a truer reflection of the total benefits of the life insurance policy than just looking at cash value performance and seeing COI charges as part of “drag.” They’re not. They provide a benefit. And that benefit should be quantified.
Think about the fact that the death benefit is an asset, not a liability. And that’s the way it should be sold. It’s not drag – it’s a benefit. It’s a guaranteed return to your heirs. It’s a hedge. No other financial instrument “self-completes” the way a life insurance policy does. Instead of shrinking corridor to the minimum, we should talk to clients about a balance between the benefits (and costs) of death benefit protection as an integral part of their accumulation goals, not just for themselves but for their family and legacy as well.
I’m incredibly bullish on accumulation VUL. That should come as no surprise to the readers of this newsletter. I own it and I overfund it at the maximum non-MEC premium. And now it should also come as no surprise that my policy is configured with a level death benefit using CVAT. Why? Because I know that, in the real world, death benefit is valuable, arguably more valuable than what the life insurer charges me for it. It’s a hedge for my family and my insurability. It’s an asset. My asset. I’m more than happy to pay for it.